

Introduction
K-12 open enrollment allows students to transfer to public schools other than their residentially assigned one, provided space is available.
School parents widely support this policy. A December 2025 YouGov poll found that 74% of K-12 parents supported open enrollment policies. Moreover, 50% of all Americans said these policies would positively impact the nation’s overall education system.
Open enrollment policies can help many students find schools that are the right fit for them. Strengthening these policies would significantly benefit the 49.4 million students enrolled in public schools in all 50 states.
But 39.4 million students, or 80% of students enrolled in public schools, reside in states with weak or ineffective open enrollment laws.
Only 16 states had strong open enrollment laws in 2025. However, four states–Iowa, Nebraska, South Carolina, and Vermont– improved their open enrollment programs in 2026.
At the same time, policymakers in 17 states considered at least 36 bills that would have improved open enrollment laws if codified.
This study updates Reason Foundation’s annual ratings and rankings of states’ open enrollment laws, highlights the latest open enrollment research, and provides other developments related to open enrollment.
New research on K-12 open enrollment
Reason Foundation’s previous reports on open enrollment included the latest research examining its benefits, common weaknesses in states’ policies, and the latest data available from states with open enrollment policies. Since then, education researchers have published new studies on the topic.
This section reviews the latest open enrollment data, explains how the policy benefits students, discusses barriers to strong policy, and shows how many states’ and districts’ open enrollment data and practices lack transparency.
New data on open enrollment participation
A Reason Foundation analysis of 27 states published in Education Next found that more than 1.7 million students used open enrollment to attend schools other than their assigned ones.
When comparing states, Florida and Texas had the most open enrollment participants, while Colorado and Delaware had the highest participation rates overall.
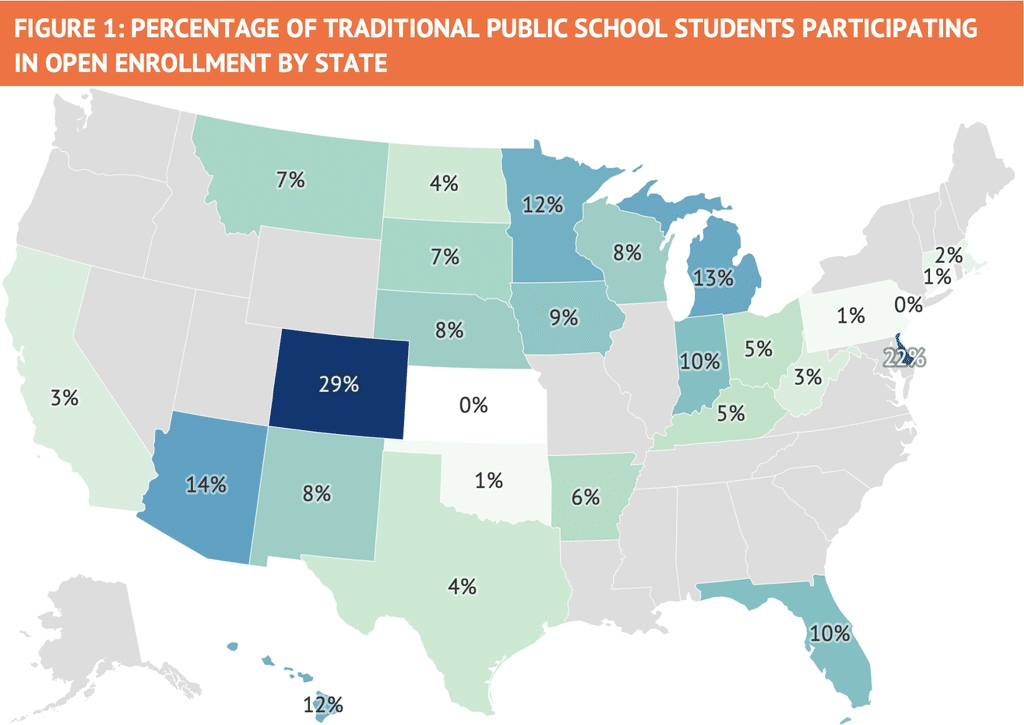
Moreover, this analysis also reviewed year-over-year data from 14 states. Data from the eight states with the largest programs (40,000 or more participants) that included five or more consecutive years of data showed that open enrollment programs tend to scale up gradually over time, as shown in Figure 2.
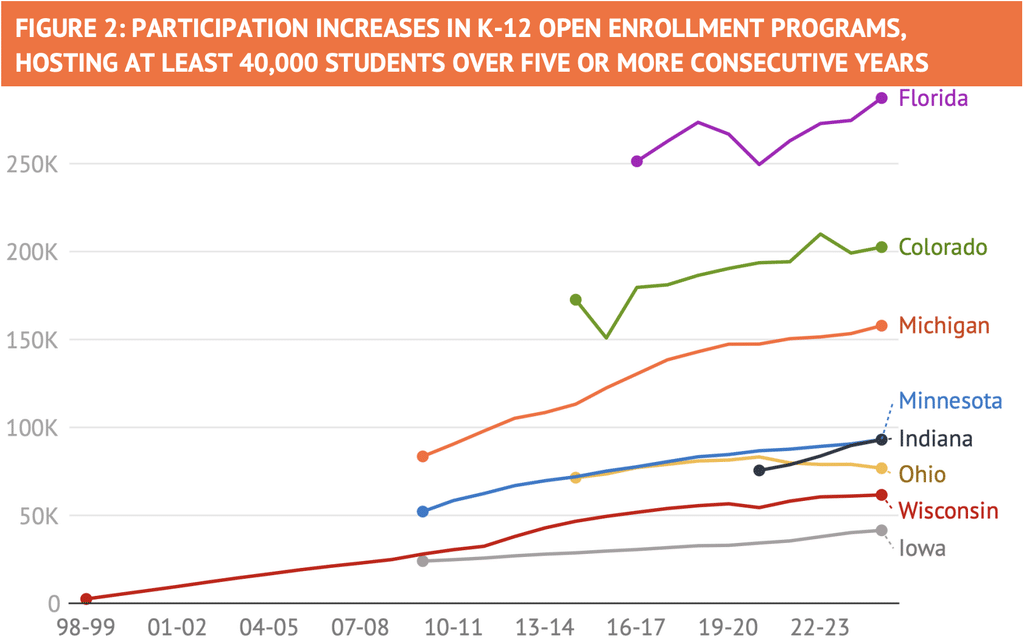
On the other hand, data from states with smaller programs were less consistent. While Massachusetts’, New Mexico’s, and South Dakota’s data showed limited increases in open enrollment programs, participation remained flat in Connecticut and North Dakota, and declined in Hawaii.
In some of these cases, weak policy design, such as participation caps, could contribute to lower participation rates.
Additionally, research finds that open enrollment programs don’t cause fluctuations in enrollment. A 2026 Show-Me Institute report finds that cross-district open enrollment in Colorado, Kentucky, Oklahoma, Tennessee, and Wisconsin did not lead to volatility in public school enrollment.
Similarly, launching these programs did not result in mass student migrations from unpopular districts to more popular ones. Moreover, these programs’ launches were not associated with school or district closures, except in Wisconsin’s case, where school closures spiked during the first year of implementation. However, the authors noted that this effect “dissipated quickly and is not replicated in other states.”
Overall, this continues to show that open enrollment programs don’t result in significant enrollment fluctuations, giving districts that lose students time to adjust.
Open enrollment benefits students
Continuing trends from previous years, students participating in Arizona’s and Arkansas’ student transfer programs tended to transfer to districts ranked higher by the state, according to Reason Foundation research.
In Arizona, 94% of cross-district transfers enrolled in districts rated as A or B, and in Arkansas, 66% of cross-district transfers enrolled in districts rated as A or B. Overall, about 115,000 students in these states transferred to districts rated as A or B by their SEAs. Arkansas’ lower transfer rate to highly rated districts is likely because there are fewer of them in Arkansas than in Arizona. For example, just 40% of Arkansas districts are rated as A or B while 76% of Arizona’s districts meet that standard.
Similarly, Wisconsin data from the 2024-25 school year showed that lower-rated districts lost more than 13,000 students while higher-rated districts gained almost the same number of transfers.
Moreover, in Wisconsin, for each transfer application received in districts categorized as “meets expectations” or lower (the two lowest tiers), about five students applied to transfer out. Requests to transfer out of higher-rated districts occurred at about half of this rate.
Additionally, an analysis of five key studies examining the relationship between open enrollment and academic achievement found statistically significant positive results or no effect in four of them.
Overall, the research showed that the effect of cross-district open enrollment on student achievement was either statistically significant positive results or null results—none were statistically negative.
However, findings on within-district open enrollment were mixed. While all three studies identified null or statistically significant positive findings, one of them also found statistically significant negative findings. The negative outcomes were driven by the timing of transfers, especially among elementary students.
Barriers to open enrollment
An analysis of Ohio districts’ open enrollment policies by Fordham Institute showed that many suburban school districts do not permit transfers—disproportionately affecting nearby low-income students living in Ohio’s eight urban centers. Non-resident students often can only access these districts if their families can pay tuition, which cost nearly $26,000 during the 2024-25 school year in Orange City Schools.
This is consistent with 2024 research showing that the average tuition in 22 Ohio districts was $11,000 per student. By contrast, Ohio districts that opt into open enrollment participation cannot charge tuition to transfer students.
A report about Colorado’s open enrollment program, used by 29% of public school students, found that the open enrollment process isn’t always transparent or family-friendly, especially for families for whom English isn’t a first language.
Moreover, districts’ admissions processes often lack uniformity, use varying timelines, and aren’t clear about which grades have open seats. These opaque practices make it challenging for parents to make informed decisions, especially when considering multiple applications whose timelines don’t align.
Measuring open enrollment capacity
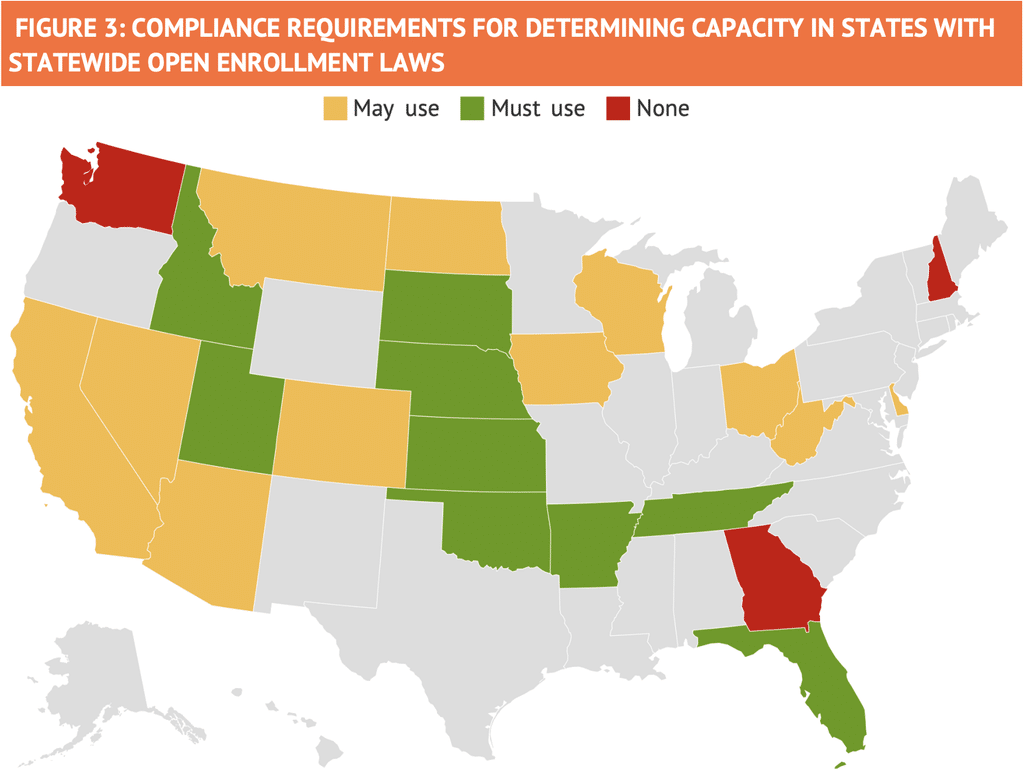
An analysis published by Reason Foundation reviewed how 23 states with statewide cross-district or within-district open enrollment laws measured capacity. Capacity measurements are important because they determine how many seats are available to non-resident students.
Unfortunately, many states’ open enrollment policies fail to standardize capacity metrics, leading to inconsistent definitions that unnecessarily limit student transfer opportunities.
In nine states, statutes outline one or more factors school districts must consider when calculating capacity, such as building capacity, class size, staffing, student-teacher ratios, program size, or grade level. Even in these cases, state laws generally don’t explain the precise methodologies school districts must use to calculate available capacity.
In 11 states, state laws suggest that districts consider certain factors, such as staffing, when determining capacity, while three states—Georgia, New Hampshire, and Washington—don’t suggest any parameters for districts to use when calculating capacity.
Overall, the most common factors mentioned in state statute to measure capacity were building capacity, class size, grade level, and program capacity.
Open enrollment funding
Reason Foundation analyses showed how states can address open enrollment funding. Of the 16 states with strong cross-district open enrollment laws, most have done so without funding provisions—ensuring that open enrollment participants transfer for free.
The state funds that accompany transfers to receiving school districts are often more than enough to cover the marginal cost of educating students. Because districts have significant discretion in setting their available capacity, they can assess how many students they can add without hiring new staff or building new facilities before reaching a tipping point in costs. Streamlined funding systems, like those in Arizona, Florida, or Arkansas, make launching robust open enrollment programs straightforward.
However, in states where funding peculiarities exist, policymakers can adopt policies to circumvent them.
For example, for nearly three decades, Wisconsin’s policy has provided receiving districts with a uniform per-pupil amount in state aid transfers—approximately $9,000 for regular students and $14,000 for students with disabilities during the 2024-25 school year. Since its implementation, Wisconsin’s open enrollment program increased from about 2,400 participants during the 1998-99 school year to nearly 62,000 participants during the 2024-25 school year.
Some districts fail to comply with state transparency requirements
The Sutherland Institute continued its reporting on Utah’s school districts’ compliance with state law to post their available capacity on their websites. The report found that just 13 out of Utah’s 41 districts complied with state code. The report also graded how transparent districts’ open enrollment processes were based on a five-part rubric.
These best practices included: compliance with state transparency requirements, clearly designating schools open or closed to transfers, posting relevant applications, providing contact information for open enrollment managers, and dedicating a full webpage to open enrollment on district websites. Just nine districts met all five criteria, while 13 districts met four out of the five best practices.
Open enrollment can weaken the effects of housing redlining
A 2026 Available to All report found that school district and attendance zone boundaries in New York continue to replicate housing redlining policies that aimed to segregate neighborhoods and schools in the early twentieth century. It identified 14 instances in New York school catchment areas across the New York City metropolitan area and five other urban areas.
In some cases, these attendance zones house some of New York City’s elite public schools, excluding students assigned to nearby lower-performing schools. The authors suggested that strong open enrollment laws and increased transparency can help students access schools that are a better fit.
Reason’s open enrollment best practices
Open enrollment best practices
Seven key components characterize robust open enrollment laws. States only receive credit for each metric if it is clearly included in their open enrollment laws. This report’s seven categories are:
#1 Statewide Cross-District Open Enrollment: School districts are required to have a cross-district enrollment policy and are only permitted to reject transfer students for limited reasons, such as school capacity.
#2 Statewide Within-District Open Enrollment: School districts are required to have a within-district enrollment policy that allows students to transfer schools within the school district and are only permitted to reject transfer requests for limited reasons, such as school capacity.
#3 Children Have Free Access to All Public Schools: School districts should not charge families transfer tuition.
#4 Public Schools Are Open to All Students: School districts shall not discriminate against transfer applicants based on their abilities or disabilities.
#5 Transparent Reporting by the State Education Agency (SEA): The State Education Agency annually collects and publicly reports key open enrollment data by school district, including transfer students accepted, transfer applications rejected, and the reasons for rejections.
#6 Transparent School District Reporting: Districts are annually required to publicly report seating capacity by school and grade level so families can easily access data on available seats. Open enrollment policies, including all applicable deadlines and application procedures, must be posted on districts’ websites.
#7 Transfer Applicants Can Appeal Rejected Applications: Districts must provide rejected applicants with the reasons for their rejection in writing. Rejected applicants can appeal their rejection to the SEA or other non-district entity, whose decision shall be final.
Ranking and methodology
For the second time, this report will assign letter grades to each state’s policy, identifying weaknesses and strengths in its laws. This system ranks states’ open enrollment policies on a scale of 0-100, assigning grades “A,” “B,” “C,” “D,” and “F” to states based on their rankings.
“A” would correspond to a score of 90+, “B” to 80+, “C” to 70+, and “D” to 60+. All lower scores are ranked as “F.”
States receive full credit when they meet a metric and partial credit when they partially meet it.
#1 Statewide cross-district open enrollment = 60 points.
This typically expands public school choice the most for students. Since it offers the most educational options, its weight is significantly greater than others, giving states a major boost in achieving a higher rank. States with voluntary or limited cross-district open enrollment receive partial credit, valued at 30 points.
#2 Statewide within-district open enrollment = 15 points. This is the second most valuable metric since it expands schooling options for students living inside a district’s geographic boundaries. This reform is worth fewer points since it’s easier to achieve because students, and their education dollars, remain inside the assigned district. States with voluntary or limited within-district open enrollment receive partial credit, valued at 5 points.
#3 School districts free to all students = 10 points.
Tuition can be a major barrier to transfer students, especially when it costs thousands of dollars. Removing this barrier is an important victory for students whose families cannot afford to pay public school tuition. There is no partial credit for this metric.
#4 School districts open to all students = 5 points.
State law should make clear to school districts that access to public schools shouldn’t depend on an applicant’s ability or disability. Open enrollment laws that clearly state that school districts cannot discriminate against transfer applicants based on their disability receive 3 points, while laws that stop school districts from discriminating against applicants based on their ability, i.e., academic achievement, GPA, past or future academic record, receive 2 points. The former is of higher value since students with disabilities have not always had equal access to education.
#5 Transparent SEA reports = 4 points.
These reports ensure policymakers, families, and taxpayers can hold school districts accountable for their open enrollment practices. Moreover, this metric often only requires tweaks to existing reports, making it an easier reform. Each component is valued at one point. To receive credit, states must codify that the SEA must publish district-level open enrollment data in an annual report = 1 point; which includes the number of transfer students = 1 point; includes the number of rejected applicants = 1 point; and includes the reasons why applicants were rejected = 1 point.
#6 Transparent district reporting = 4 points.
States that require school districts to post their policies and procedures on their websites receive 2 points; requiring districts to post their available capacity by grade level earns a state an additional 2 points. If a state requires a district to post its available capacity, but not by grade level, it can receive 1 point.
#7 Transfer applicants can appeal rejected applications = 2 points.
States that require school districts to provide rejected applicants with the reasons they were denied in writing receive 1 point, while those that offer an external appeals process to rejected applicants can receive an additional point.
Ranking states’ open enrollment policies
Using Reason Foundation’s best practices checklist as a measure: 16 states have statewide cross-district open enrollment, 17 states have statewide within-district open enrollment, 28 states make public schools free to all students, 12 states make public schools open to all students, four states’ SEAs publish annual open enrollment reports, seven states have transparent district reporting, and five states have a strong appeals process.
The most common weaknesses in states’ open enrollment laws are insufficiently transparent SEA reports.
No state fully meets all seven metrics; however, Oklahoma and Arkansas meet six out of seven.
Only Idaho and Kansas fully meet five out of seven metrics.
Arizona, California, Florida, Nebraska, Utah, West Virginia, and Wisconsin fully meet four out of seven metrics.
Based on these metrics, six states–Arkansas, Arizona, Idaho, Oklahoma, Utah, and West Virginia–ranked as “A”, seven states are ranked as “B”, two states are ranked as “C”, two states are ranked as “D”, and 33 states scored an “F.”
Table 3 shows each state’s grade and ranking in light of Reason Foundation’s best open enrollment practices.
| Rank | State | Total Score | Grade | #1 Statewide Cross-district | #2 Statewide Within-district | #3 Public Schools Free to All Students | #4 Public Schools Open to All Students | #5 Transparent SEA Reporting | #6 Transparent District Reporting | #7 External Appeals Process |
|---|---|---|---|---|---|---|---|---|---|---|
| Metric Value | 100 | 60 | 15 | 10 | 5 | 4 | 4 | 2 | ||
| 1 | Oklahoma | 99 | A+ | 60 | 15 | 10 | 5 | 4 | 4 | 1 |
| 2 | Arkansas | 98 | A+ | 60 | 15 | 10 | 5 | 4 | 2 | 2 |
| 3 | Idaho | 97 | A+ | 60 | 15 | 10 | 5 | 2 | 4 | 1 |
| 4 | Arizona | 95 | A | 60 | 15 | 10 | 3 | 2 | 4 | 1 |
| 4 | West Virginia | 95 | A | 60 | 15 | 10 | 3 | 3 | 2 | 2 |
| 5 | Utah | 91 | A- | 60 | 15 | 10 | 2 | 0 | 4 | 0 |
| 6 | Florida | 89 | B+ | 60 | 15 | 10 | 0 | 0 | 4 | 0 |
| 7 | Kansas | 88 | B+ | 60 | 5 | 10 | 5 | 4 | 4 | 0 |
| 8 | Colorado | 87 | B+ | 60 | 15 | 10 | 0 | 0 | 2 | 0 |
| 8 | Delaware | 87 | B+ | 60 | 15 | 10 | 0 | 0 | 2 | 0 |
| 9 | Nebraska | 85 | B | 60 | 5 | 10 | 5 | 3 | 0 | 2 |
| 10 | Wisconsin | 81 | B- | 60 | 5 | 10 | 0 | 4 | 0 | 2 |
| 11 | South Dakota | 80 | B- | 60 | 15 | 0 | 3 | 1 | 0 | 1 |
| 12 | Montana | 77 | C+ | 60 | 5 | 10 | 0 | 2 | 0 | 0 |
| 12 | North Dakota | 77 | C+ | 60 | 5 | 10 | 2 | 0 | 0 | 0 |
| 13 | Iowa | 67 | D+ | 60 | 5 | 0 | 0 | 2 | 0 | 0 |
| 14 | California | 62 | D- | 30 | 15 | 10 | 5 | 0 | 0 | 2 |
| 15 | Washington | 56 | F | 30 | 15 | 10 | 0 | 0 | 0 | 1 |
| 16 | Georgia | 55 | F | 30 | 15 | 10 | 0 | 0 | 0 | 0 |
| 17 | Indiana | 53 | F | 30 | 5 | 10 | 5 | 2 | 0 | 1 |
| 18 | Massachusetts | 51 | F | 30 | 5 | 10 | 5 | 1 | 0 | 0 |
| 18 | Minnesota | 51 | F | 30 | 5 | 10 | 5 | 1 | 0 | 0 |
| 18 | Ohio | 51 | F | 30 | 15 | 0 | 5 | 1 | 0 | 0 |
| 19 | Nevada | 50 | F | 30 | 15 | 0 | 0 | 3 | 2 | 0 |
| 20 | Louisiana | 49 | F | 30 | 5 | 10 | 0 | 1 | 2 | 1 |
| 20 | Tennessee | 49 | F | 30 | 15 | 0 | 0 | 0 | 4 | 0 |
| 20 | Vermont | 49 | F | 30 | 5 | 10 | 3 | 1 | 0 | 0 |
| 21 | Connecticut | 45 | F | 30 | 5 | 10 | 0 | 0 | 0 | 0 |
| 21 | New Mexico | 45 | F | 30 | 5 | 10 | 0 | 0 | 0 | 0 |
| 21 | New Hampshire | 45 | F | 30 | 15 | 0 | 0 | 0 | 0 | 0 |
| 21 | Pennsylvania | 45 | F | 30 | 5 | 10 | 0 | 0 | 0 | 0 |
| 21 | Rhode Island | 45 | F | 30 | 5 | 10 | 0 | 0 | 0 | 0 |
| 22 | Mississippi | 40 | F | 30 | 0 | 10 | 0 | 0 | 0 | 0 |
| 22 | Oregon | 40 | F | 30 | 5 | 0 | 5 | 0 | 0 | 0 |
| 23 | Hawaii | 38 | F | NA | 5 | 10 | 0 | 0 | 0 | 0 |
| 24 | South Carolina | 37 | F | 30 | 5 | 0 | 0 | 0 | 1 | 1 |
| 25 | Missouri | 36 | F | 30 | 5 | 0 | 0 | 0 | 0 | 1 |
| 25 | New Jersey | 36 | F | 30 | 0 | 0 | 5 | 0 | 0 | 1 |
| 25 | Texas | 36 | F | 30 | 5 | 0 | 0 | 1 | 0 | 0 |
| 26 | Illinois | 35 | F | 30 | 5 | 0 | 0 | 0 | 0 | 0 |
| 26 | Kentucky | 35 | F | 30 | 5 | 0 | 0 | 0 | 0 | 0 |
| 26 | Michigan | 35 | F | 30 | 5 | 0 | 0 | 0 | 0 | 0 |
| 26 | Wyoming | 35 | F | 30 | 5 | 0 | 0 | 0 | 0 | 0 |
| 27 | New York | 31 | F | 30 | 0 | 0 | 0 | 0 | 0 | 1 |
| 28 | Alabama | 5 | F | 0 | 5 | 0 | 0 | 0 | 0 | 0 |
| 28 | Virginia | 5 | F | 0 | 5 | 0 | 0 | 0 | 0 | 0 |
| 29 | Alaska | 0 | F | 0 | 0 | 0 | 0 | 0 | 0 | 0 |
| 29 | Maine | 0 | F | 0 | 0 | 0 | 0 | 0 | 0 | 0 |
| 29 | Maryland | 0 | F | 0 | 0 | 0 | 0 | 0 | 0 | 0 |
| 29 | North Carolina | 0 | F | 0 | 0 | 0 | 0 | 0 | 0 | 0 |
| Strong policies on the books | 16/49 | 17/50 | 28/50 | 12/50 | 4/50 | 7/50 | 5/50 | |||
| Strong policies (%) | 33% | 34% | 56% | 24% | 8% | 14% | 10% |
Note: See Hawaii Summary for an explanation of its score.
The full study is here: Public Schools Without Boundaries 2026
You can also click the state name below to access that state’s summary, ranking and analysis.
· Alabama
· Alaska
· Arizona
· Arkansas
· Colorado
· Delaware
· Florida
· Georgia
· Hawaii
· Idaho
· Illinois
· Indiana
· Iowa
· Kansas
· Kentucky
· Maine
· Maryland
· Michigan
· Missouri
· Montana
· Nebraska
· Nevada
· New York
· Ohio
· Oklahoma
· Oregon
· Texas
· Utah
· Vermont
· Virginia
· Wyoming