
Introduction
K-12 open enrollment allows students to transfer to public schools other than their residentially assigned schools, provided space is available. Parents with children in school widely support this policy. Polling from June 2025 by EdChoice-Morning Consult showed that 78% of school parents—including 84% of Republicans, 80% of Democrats, and 72% of Independents—support open enrollment. Moreover, of this subgroup, 84% of Republicans, 80% of Democrats, and 72% of Independents support the policy.
Additionally, “Yes. every kid” released national polling in November 2024 that showed that 65% of Americans support letting students attend schools that are the right fit for them, regardless of where they live or their families’ financial circumstances. Moreover, 58% of respondents support ending residential assignment—the practice of assigning students to schools based on where they live—in public schools.
Open enrollment policies can help many students find public schools that are the right fit for them. Strengthening these policies would be a significant boon to the 49.4 million students enrolled in public schools in all 50 states.
About 39.4 million students, or 80% of students enrolled in public schools, reside in states with weak or ineffective open enrollment laws. This study finds that only 16 states had strong open enrollment laws in 2024.
However, four states—Arkansas, Nevada, New Hampshire and South Carolina—significantly improved their open enrollment laws during the 2025 legislative sessions.
At the same time, policymakers in 24 states introduced at least 54 bills that would have improved open enrollment laws if codified according to the Reason Foundation’s open enrollment best practices. On the other hand, one proposal introduced in Oklahoma would have significantly undermined states’ strong open enrollment laws.
This study, the 4th edition of Public Schools Without Boundaries, updates Reason Foundation’s 2024 ratings and rankings of states’ open enrollment laws, highlights the latest open enrollment research, and provides other developments related to open enrollment.
New Research on K-12 Open Enrollment
Reason Foundation’s previous reports on open enrollment included the latest research examining its benefits, common weaknesses in states’ policies, and the most recent data available from states with open enrollment policies. Since then, education researchers have published new studies on the topic.
This section reviews the most recent open enrollment data available, examines how the policy benefits students, highlights barriers to effective policy, and demonstrates that many states’ and districts’ open enrollment data and practices lack transparency.
New Data on Open Enrollment Participation
A Reason Foundation study of 19 states found that more than 1.6 million students used open enrollment to attend schools other than their assigned ones. Additionally, a 2025 report by the Bluegrass Institute estimated that approximately 26,000 students used cross-district open enrollment in Kentucky during the 2023-24 school year to attend brick-and-mortar schools. Combined with Reason Foundation’s research, more than 1,627,000 students used open enrollment in 20 states.
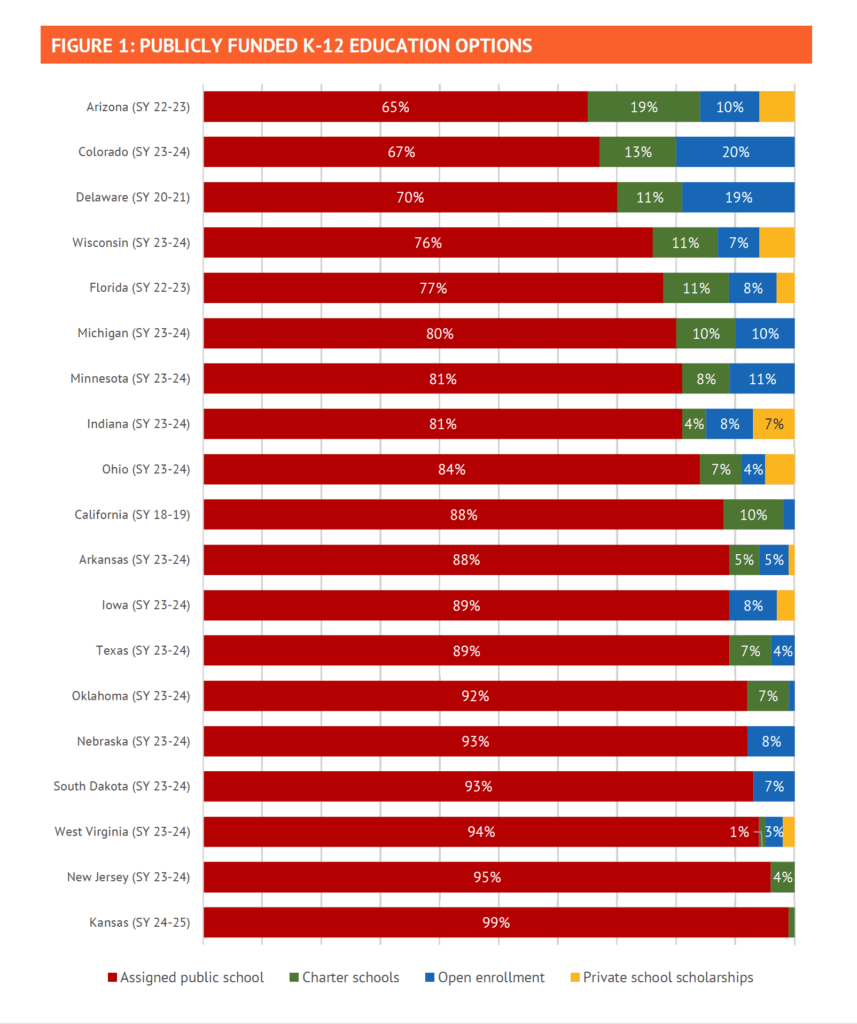
Reason Foundation’s 2025 study, “Open Enrollment by the Numbers,” reveals that, on average, 16% of students used public funds to attend a school of their choice through open enrollment, charter schools, or private school scholarships in 19 states. Students using open enrollment accounted for 7% of publicly funded students in these states, on average. Using the freshest data from each state, Figure 1 below shows the different schooling options students paid for with public funds in each state.
However, participation often varied depending on the strength of a state’s open enrollment law. For instance, on average, students using open enrollment accounted for 10% of students enrolled in public schools in states with strong open enrollment laws, whereas they accounted for only 6% of students in public schools in states with weak open enrollment.
Based on data available from 10 states, the study also found that more than two in five students using open enrollment came from low-income households, accounting for about 148,000 transfers. Additionally, one in 10 transfers in these states were also students with disabilities (SWD), benefiting about 121,000 students.
Open Enrollment Benefits Students
Continuing trends from previous years, students participating in Arizona’s, Florida’s, and Texas’ student transfer programs tended to transfer to public school districts that were ranked higher by the state.
In Arizona, 90% of cross-district transfers enrolled in districts rated as A or B; in Florida, 94% of cross-district transfers enrolled in districts rated as A or B; and in Texas, 95% of cross-district transfers enrolled in districts rated as A or B.
Overall, more than 294,000 students in these states transferred to districts rated as A or B by their state education agencies (SEAs).
Barriers to Open Enrollment
Only six states—Arizona, Florida, Idaho, Mississippi, Oklahoma, and West Virginia—allow students to transfer via open enrollment year-round. While laws in 19 states ensure a restricted transfer window, 25 states have no law addressing districts’ transfer windows.
The most common reason school districts in Oklahoma, Nebraska, and Wisconsin denied open enrollment transfers was insufficient capacity. Specifically, data from Nebraska and Wisconsin showed that 24% and 20% of rejected applicants were rejected because of lack of space in special education programs. Wisconsin’s data continued trends from previous years, showing that school districts deny students with disabilities at higher rates than their non-disabled peers.
This level of data wasn’t available for other states.
Open Enrollment Data Are Often Opaque
State education agencies often only collect limited open enrollment data. This is bad because families, taxpayers, and policymakers lack the tools to assess the impact of or demand for open enrollment programs. SEAs in 19 states were able to provide the number of students using open enrollment from recent school years. Two states–Utah and Idaho–did not collect data on the number of transfers.
Additional information, such as the number of rejected applicants or why they were denied, was often not available. Out of the 21 states reviewed, only five states—Idaho, Oklahoma, Nebraska, West Virginia, and Wisconsin—tracked the number of rejected applicants, but only three of these (Oklahoma, Nebraska, and Wisconsin) tracked rejected applicants by denial category.
Districts Often Let Transparency Fall by the Wayside
Just eight states continue to require public school districts to publish their available capacity by grade level and their open enrollment policies and procedures on their websites under state law. School districts also struggle to ensure that the open enrollment process is transparent, even when required to do so by state law.
A key component of district-level transparency is publishing the number of seats available by grade level on each district’s website. This ensures that families are aware of vacancies before submitting transfer applications.
However, many districts don’t comply with state laws that require them to make open enrollment information available online. For example, 77% of Oklahoma’s school districts comply with a state law that requires them to post their available capacity online, according to a 2025 analysis.
However, of the districts that published this information, 36% had the most recent data, and 29% had outdated data. Even when data were available, this analysis found that it was often difficult to locate on district websites. Therefore, this study recommends that school districts reconsider their practices and ensure that information about their available capacity is easily accessible on their websites, improving transparency for families and researchers.
Similarly, a report studied Utah’s school districts’ practices regarding posting their available capacity on their websites, as required by state law. The report found that most school districts don’t fully comply with state law by making their available capacity easily accessible on their websites. Only six districts published an open enrollment report as described in state statute, 15 districts published a partial capacity report, and while 20 districts did not publish a capacity report in any form, their websites gave information about open enrollment.
An audit of six Kansas districts’ reported available capacity called into question their accuracy. In particular, the report showed that even though five of the districts collectively lost more than 5,000 students since 2019, the districts’ only claimed they had space for about 2,000 transfer students during the 2024-25 school year.
Moreover, Wichita Public Schools (WPS), the largest school district in Kansas, did not comply with state law, which requires all districts to post their available capacity on their websites. Since 2019, WPS’ student counts have dropped by more than 2,600 students. These discrepancies led the author to recommend penalizing districts for misreporting their available capacity and to define the term “capacity.” In particular, he recommended basing available capacity on building capacity rather than staffing capacity.
Open Enrollment Can Weaken the Effects of Housing Redlining
School district and attendance zone boundaries in Missouri and California continue to replicate housing redlining policies that aimed to segregate neighborhoods and schools in the early 20th century, according to a 2025 Available to All report, a nonpartisan watchdog organization. It identified three instances where Missouri school districts were affected by these boundaries, which continue to limit students’ schooling options based on where they live.
Similarly, in California’s Los Angeles Unified School District (LAUSD)—the second-largest school district in the nation—Available to All identified eight instances where the district’s attendance zones were redlined. These attendance zones housed some of LAUSD’s elite public schools and excluded students from nearby neighborhoods who were assigned to lower-performing schools. The authors suggested that strong open enrollment laws can help students access schools that are a better fit.
Open Enrollment Best Practices
Seven key components characterize robust open enrollment laws. In Reason’s calculations, states only receive credit for each metric if it is clearly included in their open enrollment laws.
| Table 1: Reason’s Seven Best Practices for Open Enrollment |
|---|
| #1 Statewide Cross-District Open Enrollment: School districts are required to have a cross-district enrollment policy and are only permitted to reject transfer students for limited reasons, such as school capacity. |
| #2 Statewide Within-District Open Enrollment: School districts are required to have a within-district enrollment policy that allows students to transfer schools within the school district and are only permitted to reject transfer requests for limited reasons, such as school capacity. |
| #3 Children Have Free Access to All Public Schools: School districts should not charge families transfer tuition. |
| #4 Public Schools Are Open to All Students: School districts shall not discriminate against transfer applicants based on their abilities or disabilities. |
| #5 Transparent Reporting by the State Education Agency (SEA): The State Education Agency annually collects and publicly reports key open enrollment data by school district, including transfer students accepted, transfer applications rejected, and the reasons for rejections. |
| #6 Transparent School District Reporting: Districts are annually required to publicly report seating capacity by school and grade level so families can easily access data on available seats. Open enrollment policies, including all applicable deadlines and application procedures, must be posted on districts’ websites. |
| #7 Transfer Applicants Can Appeal Rejected Applications: Districts must provide rejected applicants with the reasons for their rejection in writing. Rejected applicants can appeal their rejection to the SEA or other non-district entity, whose decision shall be final. |
Open Enrollment Rankings and Methodology
Rankings assign letter grades to each state’s policy, identifying weaknesses and strengths in their laws. This system ranks open enrollment policies on a scale of 0-100, assigning grades “A,” “B,” “C,” “D,” and “F” to states based on their rankings. “A” would correspond to a score of 90+, “B” to 80+, “C” to 70+, and “D” to 60+. All lower scores are ranked as “F.” States receive full credit when they meet a metric, and partial credit when a metric is only partially met.
| Metric | Partial Value | Full Value |
|---|---|---|
| 1. Statewide cross-district open enrollment | 60 | |
| Voluntary cross-district open enrollment | 30/60 | |
| 2. Statewide within-district open enrollment | 15 | |
| Voluntary within-district open enrollment | 5/15 | |
| 3. School districts free to all students | 10 | |
| 4. School districts open to all students | 5 | |
| Prohibit discrimination based on ability | 2/5 | |
| Prohibit discrimination based on disability | 3/5 | |
| 5. Transparent SEA reports | 4 | |
| The state publishes annual reports | 1/4 | |
| Includes the number of transfer students | 1/4 | |
| Includes the number of rejected applicants | 1/4 | |
| Includes the reasons why applicants were rejected | 1/4 | |
| 6. Transparent district reporting | 4 | |
| Districts must post their available capacity by grade level | 2/4 | |
| Districts must post their open enrollment policies and procedures | 2/4 | |
| 7. Transfer applicants can appeal rejected applications | 2 | |
| Districts must provide reasons for rejections in writing | 1/2 | |
| Rejected applicants can appeal to a non-district entity | 1/2 | |
| Total Possible Points | 100 |
#1 Statewide cross-district open enrollment = 60 points.
This practice typically expands public school choice the most for students. Since it offers the most educational options, its weight is significantly greater than others, giving states a significant boost in achieving a higher rank. States with voluntary or limited cross-district open enrollment receive partial credit, valued at 30 points.
#2 Statewide within-district open enrollment = 15 points.
This is the second most valuable metric since it expands schooling options for students living inside a district’s geographic boundaries. This reform is worth fewer points since it’s easier to achieve because students and their education dollars remain inside the assigned district. States with voluntary or limited within-district open enrollment receive partial credit, valued at 5 points.
#3 School districts free to all students = 10 points.
Tuition can be a major barrier to transfer students, especially when it costs thousands of dollars. Removing this barrier is an important victory for students whose families cannot afford to pay public school tuition. There is no partial credit for this metric.
#4 School districts open to all students = 5 points.
State law should make clear to school districts that access to public schools shouldn’t depend on an applicant’s ability or disability. Open enrollment laws that clearly state that school districts cannot discriminate against transfer applicants based on their disability receive 3 points, while states that stop school districts from discriminating against applicants based on their ability, i.e., academic achievement, GPA, past or future academic record, receive 2 points. The former is of higher value since students with disabilities have not always had equal access to education.
#5 Transparent SEA reports = 4 points.
These reports ensure policymakers, families, and taxpayers can hold school districts accountable for their open enrollment practices. Because this metric often only requires tweaks to existing reports, making it an easier reform, each component is valued at one point. To receive credit, states must codify that the SEA publishes district-level open enrollment data in an annual report, which includes the number of transfer students (1 point), the number of rejected applicants (1 point), and the reasons why applicants were rejected (1 point).
#6 Transparent district reporting = 4 points.
States that require districts to post their policies and procedures on their websites receive 2 points; requiring districts to post their available capacity by grade level earns a state an additional 2 points. If a state requires a district to post its available capacity, but not by grade level, it receives 1 point.
#7 Transfer applicants can appeal rejected applications = 2 points.
States that require school districts to provide rejected applicants with the reasons for their denial in writing receive 1 point, while those that offer an external appeals process to rejected applicants receive an additional point.
Ranking Every State’s Open Enrollment Policies
The most common weaknesses in states’ open enrollment laws are poor appeals processes or insufficiently transparent SEA reports. No state fully meets all seven metrics.
However, Oklahoma and Arkansas fully meet six out of seven metrics. Only Idaho fully meets just five out of seven metrics, and only Arizona, Delaware, Florida, Utah, and West Virginia fully meet just four out of seven metrics.
Using Reason Foundation’s best practices checklist as a measure: 16 states have statewide cross-district open enrollment, 17 states have statewide within-district open enrollment, 28 states make public schools free to all students, 10 states make public schools open to all students, five states’ SEAs publish annual open enrollment reports, eight states have transparent district reporting, and four states have a strong appeals process.
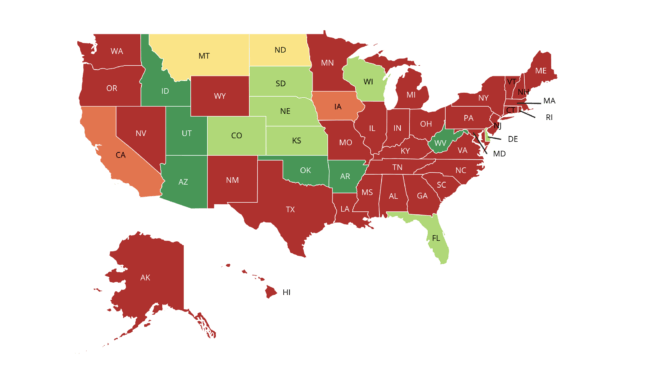
Based on these metrics, six states–Arkansas, Arizona, Idaho, Oklahoma, Utah, and West Virginia–are ranked as “A”, seven states are ranked as “B”, two states are ranked as “C”, two states are ranked as “D”, and 33 states score an “F.”
Table 3 presents each state’s grade and ranking in relation to Reason Foundation’s best open enrollment practices.
TABLE 3: STATE-BY-STATE OPEN ENROLLMENT ANALYSIS AS OF 2025
Note: See Hawaii Summary for an explanation of its score.
Download this Resource
Public Schools Without Boundaries 2025
by Jude Schwalbach
Thank you for downloading!