

Introduction
Reason Foundation’s 2022 K-12 Education Spending Spotlight includes both real and nominal U.S. Census Bureau data for all 50 states dating back to 2002, which is the starting point for continuous state-level summary figures.
Reporting from the 2020 fiscal year is the most recent school finance data available at this time. Reason Foundation’s K-12 Education Spending Spotlight data analysis and dashboard with 2019 data can be found here.
2020 Data Highlights
- Inflation-adjusted per-pupil education revenue increased in 49 of 50 states between 2002 and 2020.
- While spending went up, 22 states plus the District of Columbia saw declines in student enrollment during this time.
- Between 2002 and 2020 total education spending on employee benefits (such as pensions and healthcare) in the U.S. nearly doubled from $90 billion to $164 billion a year.
- Overall inflation-adjusted spending on salaries grew much less – from $342 billion to $372 billion – in this time period.
- Per-pupil education spending on total benefits increased by an average of $1,499 while per-pupil spending on total salaries increased by $492 between 2002 and 2020.
- All 50 states saw real per-pupil spending increases on total benefits between 2002 and 2020. During that time, 14 states saw benefit spending grow by over 100% and two states saw growth of 200% or more.
- In 2020, total education system long-term debt surpassed $500 billion, reaching a total of $505 billion in the U.S. Between 2002 and 2020 long-term debt grew by $188 billion or $3,798 per student.
K-12 Education Revenue Growth
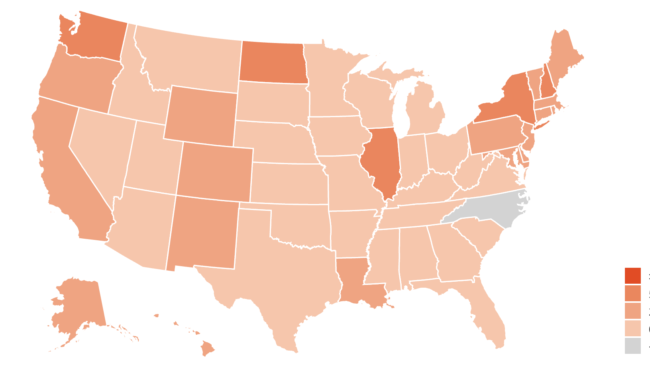
Nationwide, inflation-adjusted per-pupil K-12 revenues grew by 25%—or by $3,211 per student—between 2002 and 2020. During this time, per-pupil revenues increased in all but one state (North Carolina). Sixteen states, plus D.C., increased their education funding by 30% or more during this time period. In the most recent year, education spending grew by $8 billion across the United States, for an average increase of $169 per-pupil from the 2018-2019 school year to the 2019-2020 school year.
The below map displays the rates at which states have increased their education spending since 2002. Users can explore various data and national education spending trends using the drop-down and slider in the interactive map.
Well before the pandemic decimated student enrollment numbers, many states were already losing students. The District of Columbia and Michigan both saw over a 24% decline in students between 2002 and 2020. Overall, 22 states and D.C. experienced enrollment declines between 2002 and 2020. All these states, with the exception of Michigan, increased their total inflation-adjusted education spending during that time.
In per-pupil terms, every state except North Carolina saw an increase in education revenue from 2002 to 2020. Table 1 below shows the rates at which states have increased education spending since 2002 and the changes in student enrollment figures during that time period.
Table 1: Changes in Per-Pupil Revenue from 2002 to 2020 by State
| State | 2020 Total Per-Pupil Revenue | Total Per-Pupil Revenue Change 2002-2020 (Inflation Adjusted) | Enrollment Change 2002-2020 |
| New York | $ 30,723 | 70% | -11% |
| New Hampshire | $ 20,131 | 56% | -17% |
| Illinois | $ 20,197 | 55% | -6% |
| North Dakota | $ 16,624 | 51% | 10% |
| Washington | $ 17,685 | 50% | 13% |
| Pennsylvania | $ 21,524 | 49% | -12% |
| Vermont | $ 23,575 | 49% | -12% |
| Connecticut | $ 24,875 | 45% | -12% |
| California | $ 16,934 | 36% | -8% |
| Delaware | $ 20,032 | 34% | 11% |
| Alaska | $ 19,783 | 32% | -1% |
| Louisiana | $ 13,753 | 32% | -12% |
| Maryland | $ 18,581 | 31% | 6% |
| Rhode Island | $ 19,574 | 31% | -15% |
| Wyoming | $ 19,384 | 30% | 7% |
| Maine | $ 17,584 | 30% | -15% |
| District of Columbia | $ 31,205 | 30% | -26% |
| Colorado | $ 14,496 | 28% | 20% |
| Oregon | $ 15,844 | 28% | 6% |
| Hawaii | $ 18,756 | 27% | -2% |
| New Jersey | $ 24,010 | 27% | 2% |
| Massachusetts | $ 21,132 | 26% | -6% |
| New Mexico | $ 14,394 | 26% | -2% |
| United States | $ 16,062 | 25% | 2% |
| Minnesota | $ 16,762 | 25% | -2% |
| Kentucky | $ 12,715 | 25% | 6% |
| Montana | $ 13,769 | 25% | -2% |
| Kansas | $ 14,588 | 25% | 6% |
| Mississippi | $ 10,774 | 21% | -6% |
| Iowa | $ 14,310 | 19% | 6% |
| South Carolina | $ 14,324 | 19% | 12% |
| Tennessee | $ 10,971 | 18% | 13% |
| South Dakota | $ 12,410 | 18% | 10% |
| Arkansas | $ 11,828 | 17% | 6% |
| Nebraska | $ 14,717 | 17% | 16% |
| Utah | $ 10,027 | 17% | 26% |
| Texas | $ 13,346 | 16% | 26% |
| Virginia | $ 13,998 | 15% | 12% |
| Alabama | $ 11,729 | 15% | 2% |
| Ohio | $ 16,064 | 15% | -12% |
| West Virginia | $ 14,163 | 15% | -7% |
| Nevada | $ 11,755 | 12% | 25% |
| Michigan | $ 15,967 | 10% | -25% |
| Oklahoma | $ 10,956 | 8% | 6% |
| Florida | $ 11,526 | 8% | 14% |
| Wisconsin | $ 15,015 | 7% | -3% |
| Georgia | $ 13,605 | 6% | 18% |
| Missouri | $ 12,402 | 6% | -3% |
| Arizona | $ 10,790 | 4% | 9% |
| Idaho | $ 9,802 | 3% | 17% |
| Indiana | $ 13,368 | 2% | 0% |
| North Carolina | $ 10,790 | 0% | 11% |
State dollars accounted for the largest slice of the K-12 funding pie at 47% in 2020. Figure 2 displays how education funding sources, as well as total funding by state, have changed over time. Select a state from the drop-down menu to find state-specific metrics over time.
Instruction and Support Service Spending
Instruction and support services are the largest spending categories for schools each year. These categories cover everything from teacher salaries to school counseling services. Between 2002 and 2020, instruction expenditures increased from $6,818 per-pupil to $8,176 per-pupil. Interestingly, salaries only accounted for about $226 of this per-pupil growth while spending on benefits, such as retirement and health care, soared by $995 per-pupil during that time
Inflation-adjusted support service expenditures grew from $3,841 per pupil in 2002 to $4,815 per pupil in 2020. Salaries accounted for $268 of this growth while spending on benefits increased by $473 per pupil.
Between 2002 and 2020, the total amount spent on instructional and support benefits in the U.S. nearly doubled from $87 billion to $159 billion a year (or from $1,840 per pupil to $3,307 per pupil). Overall spending on instructional and support services salaries grew from $331 billion to $360 billion in the U.S. in this time period (from $7,014 per pupil to $7,509 per pupil).
Between the 2018-19 and 2019-20 school years, increased spending on instructional benefits far outpaced spending increases on salaries in some states. In Hawaii, spending on instructional benefits increased by more than double the increased spending on instructional salaries—benefits went up by $246 per pupil while salaries increased by $120 per pupil from year to year. In Kentucky, spending on instructional benefits went up by $9 per pupil between the 2018-19 and 2019-20 school years, while spending on salaries actually decreased by $96 per pupil.
A Closer Look at Support Services
Importantly, the support services category covers a wide range of expenditures. To get a better understanding of how these categories further break down, readers can examine the financial accounting manual published by the National Center for Education Statistics.
Note that spending increases between 2002 and 2020 weren’t disproportionately absorbed by schools or general administration, which grew from $629 to $758 per pupil and $224 to $265 per pupil, respectively. The biggest increase in support services came from growth in pupil support services, which increased from $566 per pupil to $864 per pupil. This category includes non-instructional items such as psychological, guidance, and health care-related expenditures. It also includes paraprofessional services offered to students with disabilities such as speech pathology and occupational therapy. You can view a breakdown of support service spending for every state using the drop-down in the right-hand corner of the below visualization.
Also note that the biggest single cost under this group is operation and maintenance, which accounted for 25% of all support services in 2020. This includes items like building repairs, security, and groundskeeping. Spending on this category actually fell between the 2019 and 2020 school years, reversing the nine-year trend of continued growth.
More on Total Benefit Growth
A substantial cost-driver for K-12 education is spending on benefits. Total benefits are a Census Bureau expenditure category that includes retirement contributions, pension costs, health care insurance, retiree health care insurance, workers compensation, and other expenses for school employees. Disaggregated figures aren’t available, but research suggests that teacher pension costs are responsible for a substantial share of the observed growth in benefit expenditures. Inflation-adjusted total benefit costs rose dramatically between 2002 and 2020. Every state saw real per-pupil spending increases on total benefit expenditures. 14 states saw benefit spending grow by over 100% and two states, Illinois (200%) and Hawaii (260%) saw growth of 200% or more.
Nationally, the average expenditure on benefits was $3,406 per-pupil in 2020, up 79% since 2002.
Table 2: Total Benefit Spending by State
| State | 2020 Benefit Spending Per-Pupil | Per-Pupil Benefit Spending Increase from 2002-2020 (Inflation Adjusted) |
| Hawaii | $ 5,014 | 260% |
| Illinois | $ 6,063 | 200% |
| Pennsylvania | $ 5,656 | 174% |
| New Hampshire | $ 4,639 | 142% |
| New York | $ 7,069 | 141% |
| Connecticut | $ 6,224 | 139% |
| New Jersey | $ 6,233 | 133% |
| Vermont | $ 5,618 | 130% |
| Alaska | $ 5,304 | 124% |
| Kentucky | $ 3,536 | 120% |
| California | $ 3,932 | 120% |
| Washington | $ 3,483 | 118% |
| Colorado | $ 2,493 | 105% |
| North Dakota | $ 3,294 | 102% |
| Louisiana | $ 3,243 | 98% |
| Kansas | $ 2,623 | 92% |
| Delaware | $ 4,958 | 91% |
| Massachusetts | $ 4,769 | 85% |
| Rhode Island | $ 4,901 | 79% |
| North Carolina | $ 2,340 | 79% |
| Wyoming | $ 4,484 | 79% |
| United States | $ 3,406 | 79% |
| Virginia | $ 3,303 | 76% |
| Maryland | $ 4,035 | 71% |
| Arizona | $ 1,710 | 68% |
| Nebraska | $ 2,856 | 57% |
| Oregon | $ 4,124 | 57% |
| Tennessee | $ 1,992 | 57% |
| Minnesota | $ 2,981 | 55% |
| Michigan | $ 4,286 | 54% |
| Missouri | $ 2,267 | 54% |
| Mississippi | $ 2,020 | 54% |
| Nevada | $ 2,487 | 53% |
| South Carolina | $ 2,772 | 52% |
| Oklahoma | $ 1,864 | 49% |
| Utah | $ 2,255 | 48% |
| New Mexico | $ 2,319 | 47% |
| Georgia | $ 2,963 | 44% |
| Ohio | $ 3,174 | 42% |
| Alabama | $ 2,281 | 41% |
| D.C. | $ 3,194 | 39% |
| Iowa | $ 2,596 | 36% |
| Arkansas | $ 1,753 | 35% |
| Montana | $ 2,227 | 34% |
| Maine | $ 3,743 | 34% |
| South Dakota | $ 1,815 | 31% |
| Texas | $ 1,295 | 24% |
| Indiana | $ 3,252 | 21% |
| Florida | $ 1,791 | 18% |
| West Virginia | $ 3,390 | 17% |
| Idaho | $ 1,800 | 9% |
| Wisconsin | $ 3,106 | 4% |
Education Debt Obligations by State
The Census Bureau also reports how much short and long-term debt school districts across the county have on their balance sheets each year. In 2020, K-12 long-term debt surpassed $500 billion, reaching a total of $505 billion. Between 2002 and 2020 long-term debt grew by $188 billion or $3,798 per student in real terms. It is important to note that these totals do not include any pension or other post-employment debt states and schools owe.
Conclusion
Reason Foundation’s K-12 Education Spending Spotlight can help state policymakers and other stakeholders make informed policy decisions that best serve students. The full 2019 Spending Spotlight with data for all 50 states is available here.
Additional analysis of 2020 education spending can be found below:
- How K-12 support services spending can divert education funding from instruction
- Increases in education spending have little correlation with actual student counts, data show
Methodology
The educational finance data used for this report come from Census Bureau’s Annual Survey of School Style Finances (F-33 survey). The full F-33 survey reports figures at the district level – the data used in this report come from the aggregated state summary tables which are aggregated by Census. Due to differences in state financial accounting methods, Census makes adjustments to make the state data more comparable.
These charts and underlying data utilize Census reported fall enrollment to calculate per pupil figures. This is consistent with Census reported per pupil figures, except for “Total Instruction” and “Current Spending”. For these categories, at the per pupil level, Census pulls out certain categories (e.g., payments to charters and private schools for “Total Instruction”).
A consequence of this is that in the “K-12 Instructional Spending” chart there are instances (Rhode Island and D.C.) where the Total Instructional figure is less than the sum of instruction salary and benefits. While the total figure is consistent with Census reporting, this results in a negative “Other” value which is calculated from the other three variables (Other = Total – (Salary + Benefits)).
The inflation-adjusted figures are scaled with the Consumer Price Index for All Urban Consumers (CPI) using monthly figures that are averaged over the fiscal year (July to June). Inflation-adjusted figures are in FY 2020 dollars.