


Policymakers can only pursue comprehensive and effective school finance reform when meaningful and accessible data is available to all stakeholders.
To provide better access to Arizona’s K-12 school finance data and present stakeholders with important education funding trends, Reason Foundation’s education policy team has created this interactive data portal.
Interactive Data Visualization Tool: Arizona School Finance Dashboard
This tool allows users to select student demographic variables like student poverty rates, ethnicity, special education counts, and English language learners as a percentage of district population to see how these factors compare to per-pupil revenue distributions.
The data and charts displayed in the portal ultimately show how varying degrees of property wealth can drive education funding inequities across the state. These funding disparities often result in disadvantaged students not getting their fair share of the state’s education resources.
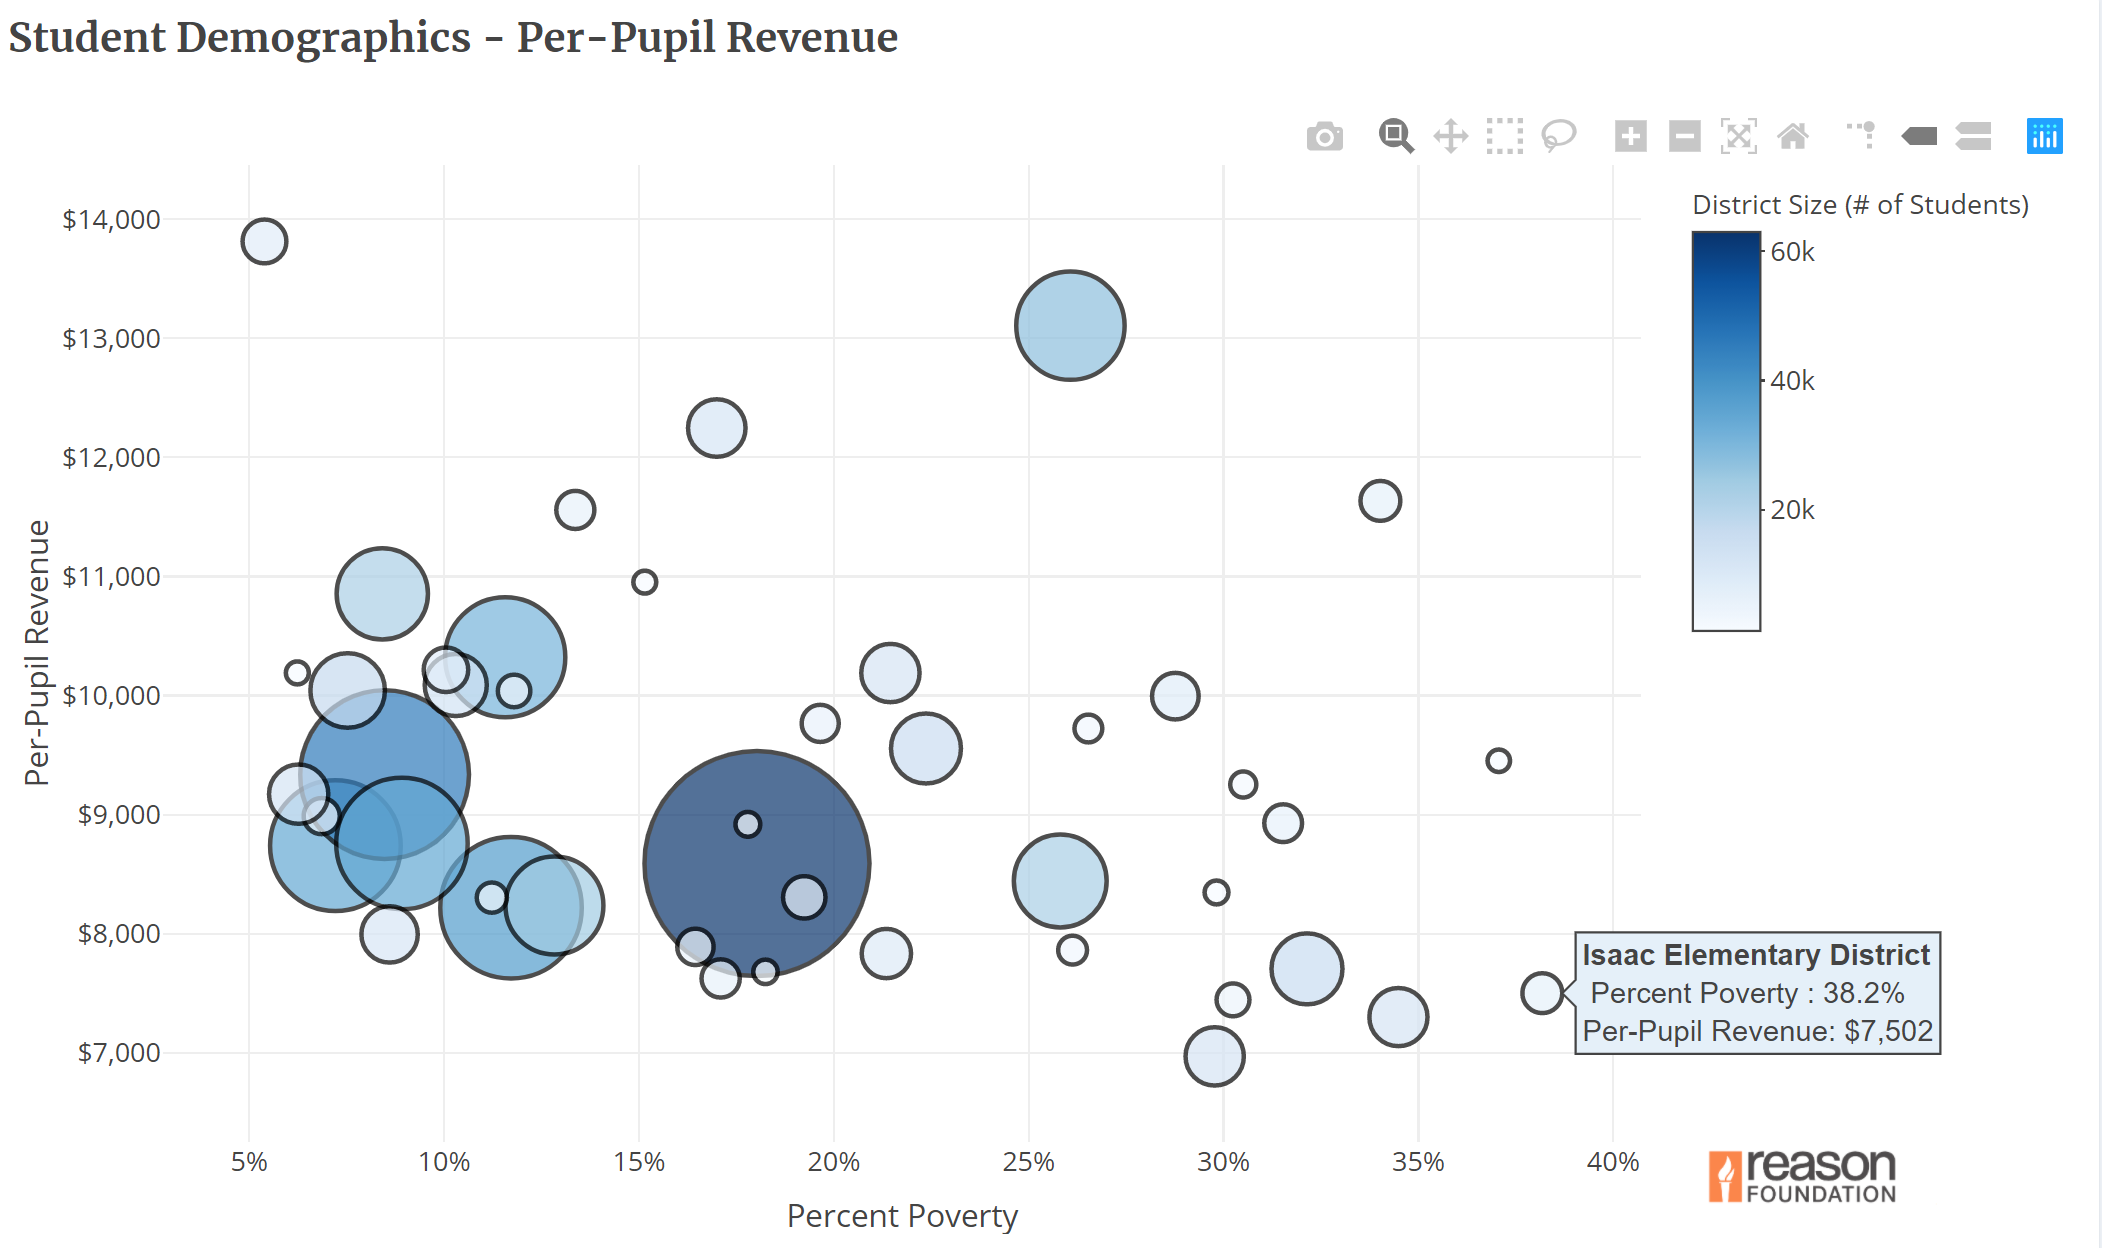
For example, in looking at the school districts in Arizona’s largest county, Maricopa, the tool shows that Isaac Elementary School District, where 38 percent of students are in poverty, receives $7,502 per student. In stark contrast, Queen Creek Unified School District, where just five percent of students are in poverty, gets $13,812 per student— 184 percent more than Isaac Elementary School District.
We recommend viewing this interactive chart on a desktop for the best user experience.
Please note that the interactive tool will automatically sleep after a certain idle time and can be restarted by simply refreshing the page.