

In the wake of the New Hampshire Supreme Court’s ruling that school districts must pay when their students transfer to public schools in other districts, legislators are considering changes to the state’s open enrollment policy.
Open enrollment, a popular policy in states such as Wisconsin, Delaware, and Florida, allows public-school students to transfer within or across school-district boundaries to schools other than those to which they are residentially assigned.
New Hampshire House Bill 751 and Senate Bill 101 would expand the state’s voluntary cross-district open enrollment program statewide, allowing students to transfer to any public school with available capacity.
Research shows that open enrollment policies benefit students and school districts alike. Expanding the public-school opportunities available to students empowers families to match their children with schools that best fit their goals and needs. It also encourages competition among public schools to attract students and provides districts with a means to recoup funding losses associated with declining local enrollment.
Yet some school districts worry that statewide cross-district open enrollment will drain their students and funding, suddenly and unpredictably. Somersworth Superintendent John Shea, for example, claimed the legislation would be “a wrecking ball of chaos” for public-school budgets.
But data from other states tell a different story, with two clear takeaways: open enrollment participation typically starts small and tends to scale up incrementally over time. As such, neither HB 751 nor SB 101 is likely to cause the budgetary disruption that some New Hampshire school districts fear.
Key Takeaway #1: Open enrollment participation typically starts small.
Fortunately for New Hampshire, statewide cross-district open enrollment is not a new experiment; 16 states have already codified such programs, one of the oldest of which (Wisconsin’s) has been in steady operation for more than 27 years. Each open enrollment law represents a case study in the painless feasibility and benefits of enacting robust public-school transfer policies. Table 1 below compiles open enrollment data for the inaugural year of three statewide cross-district programs: Kansas, West Virginia, and Wisconsin. The data provides a glimpse of the transfer rates that New Hampshire could expect in year one of HB 751 or SB 101.
Table 1. Open Enrollment Participation in Year One of Statewide Cross-District Programs
| State (Inaugural Year) | Public-School Enrollment* | Cross-District Transfers | Within-District Transfers | Total Transfers | |||
| Kansas (24–25) | 436,940 | 1,519 | 0.35% | ** | ** | 1,519 | 0.35% |
| West Virginia (23–24) | 245,047 | 1,427 | 0.58% | 6,135 | 2.50% | 7,562 | 3.09% |
| Wisconsin (98–99)*** | 862,093 | 2,464 | 0.29% | ** | ** | 2,464 | 0.29% |
* Charter-school enrollment is excluded from these public-school enrollment totals.
** Within-district transfer data were not available for Kansas and Wisconsin at the time of publication.
*** Wisconsin’s cross-district open enrollment data may be marginally understated due to a statutory provision permitting resident school boards to cap outbound transfers during the program’s first eight years. However, if all 69 percent-cap denials during the program’s inaugural year had instead been approved, total cross-district transfers that year would have reached just 2,533, still equating to only 0.29% of statewide enrollment.
The clear takeaway is that cross-district transfers in an open enrollment program’s first year are minimal. In Wisconsin, Kansas, and West Virginia, the transfers accounted for only 0.29%, 0.35%, and 0.58% of total public-school enrollment, respectively, a three-state mean of 0.41%.
Even so, Wisconsin’s and Kansas’ rates, and therefore the three-state mean, would likely have been even lower had those states also offered competing school choice options, like New Hampshire’s universal education savings accounts and statewide within-district transfers (the more popular open enrollment option in states allowing both types).
To put this into perspective, if a New Hampshire cross-district open enrollment program were to mirror these inaugural participation rates (i.e., 0.29%–0.58% of the state’s 2025–2026 fall public-school enrollment), the total number of students transferring across school districts during the program’s first year would range from 416 to 847 students. This would amount to between three and five such transfers per school district, on average (or roughly one to two per school). Inaugural participation at the 0.41% mean rate, however, would total just 589 transfers statewide, an average of only four transfer students per district and one per school.
Importantly, these figures represent cumulative, not net, district-crossing transfers: both those into a district and those out of it. Most school districts should expect a marginal net impact, if any, on public-school enrollment and funding, especially in the traditionally low-participatory first year of such a program. While actual district-level participation rates would vary, school districts with 3,275 students or fewer would not even see 10 transfers, and no district in New Hampshire would see more than 32 transfer students at Wisconsin’s 0.29% inaugural rate. And even at the 0.58% starting rate of West Virginia’s program, only two school districts (those with more than 4,051 students) of New Hampshire’s 163 would see more than 23 transfers.
Key Takeaway #2: Open enrollment participation tends to scale up incrementally over time.
Contrary to concerns that open enrollment could overwhelm public-school districts with unmanageable waves of transfers, open enrollment programs are not prone to abrupt changes in participation. In fact, Figure 1 below illustrates how open enrollment participation increased gradually and predictably over time for the eight largest programs in the country: Colorado, Florida, Indiana, Iowa, Michigan, Minnesota, Ohio, and Wisconsin.
Figure 1: Open Enrollment Participation Growth Over Time in the Eight Largest Programs
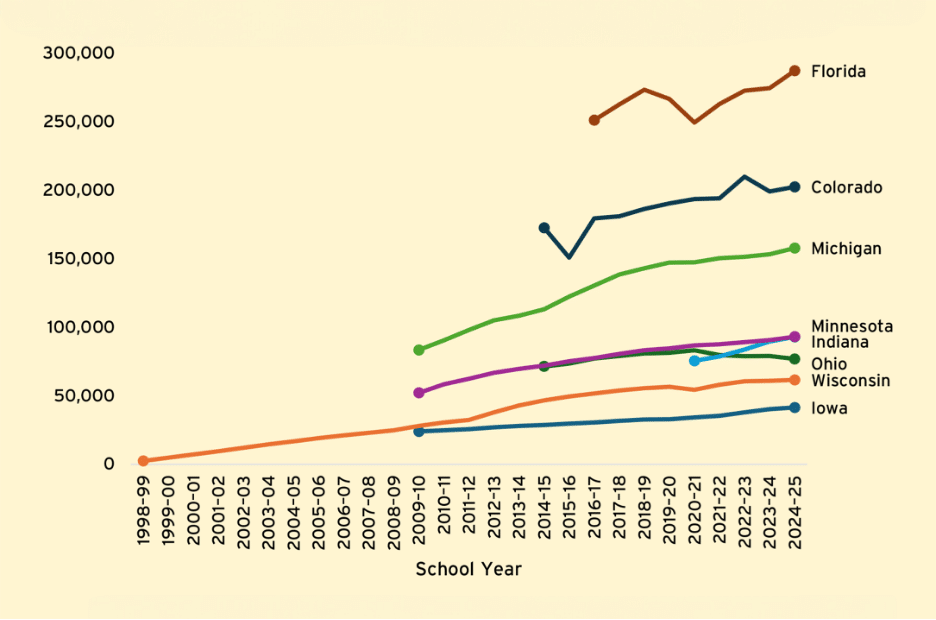
Note: Colorado’s and Florida’s open enrollment participation data include within-district transfers, which, as of the 2024–2025 school year, accounted for 71.6% of Colorado’s and 97.5% of Florida’s total open enrollment transfers. Data for the remaining six states reflect cross-district transfers only.
Districts in these eight states did not experience surges of transfers when they adopted open enrollment policies. With limited exceptions, open enrollment participation grew steadily and in a manageable way over time, giving districts time to adjust to enrollment changes.
Wisconsin’s yearly cross-district open enrollment data, shown in Table 2 below, further reinforces this trend.
Table 2. Wisconsin Cross-District Open Enrollment Transfers by Year
| Year | Public-School Enrollment* | Cross-District Transfers | |
| 1998–1999 | 862,093 | 2,464 | 0.29% |
| 1999–2000 | 859,374 | 4,858 | 0.57% |
| 2000–2001 | 856,899 | 7,213 | 0.84% |
| 2001–2002 | 855,725 | 9,602 | 1.12% |
| 2002–2003 | 854,688 | 12,113 | 1.42% |
| 2003–2004 | 855,139 | 14,527 | 1.70% |
| 2004–2005 | 853,363 | 16,751 | 1.96% |
| 2005–2006 | 837,313 | 19,056 | 2.28% |
| 2006–2007 | 843,956 | 21,104 | 2.50% |
| 2007–2008 | 842,879 | 22,948 | 2.72% |
| 2008–2009 | 836,860 | 24,899 | 2.98% |
| 2009–2010 | 830,433 | 27,991 | 3.37% |
| 2010–2011 | 825,382 | 30,486 | 3.69% |
| 2011–2012 | 822,086 | 32,421 | 3.94% |
| 2012–2013 | 816,667 | 37,941 | 4.65% |
| 2013–2014 | 817,428 | 42,877 | 5.25% |
| 2014–2015 | 817,637 | 46,645 | 5.70% |
| 2015–2016 | 815,601 | 49,434 | 6.06% |
| 2016–2017 | 811,893 | 51,727 | 6.37% |
| 2017–2018 | 808,996 | 53,915 | 6.66% |
| 2018–2019 | 805,567 | 55,497 | 6.89% |
| 2019–2020 | 803,237 | 56,570 | 7.04% |
| 2020–2021 | 799,062 | 54,408 | 6.81% |
| 2021–2022 | 782,940 | 58,094 | 7.42% |
| 2022–2023 | 778,151 | 60,512 | 7.78% |
| 2023–2024 | 772,428 | 60,961 | 7.89% |
| 2024–2025 | 764,089 | 61,642 | 8.07% |
*Charter-school enrollment may not be excluded from these public-school enrollment totals.
** While the first eight years of Wisconsin’s cross-district open enrollment data may be marginally understated (due to a statutory provision that permitted resident school boards to cap out-of-district transfers at a percentage of their enrollment), only between 35 and 141 transfer denials per year were explicitly attributed to this cap. Even if all those transfers had been approved, cross-district transfers as a percentage of statewide public-school enrollment would have been no more than 0.0165 percentage points higher in each of those years.
Not only did cross-district transfers in Wisconsin remain below 2% of total enrollment for the first seven years of the statewide program, but growth has been markedly slow and linear throughout. In the first 11 years, for example, transfers as a percentage of statewide public K–12 enrollment increased by between 0.22 and 0.31 percentage points annually, and by 0.27 percentage points on average.
Year-over-year growth in the number of transfers has also steadily decelerated, falling to under 2% annually in each of the last two years. Just 449 and 681 additional students participated statewide in the 2023–2024 and 2024–2025 school years, respectively, signaling that participation in the program may be approaching its equilibrium.
Wisconsin’s steady but slowing 27-year climb to an 8.07% cross-district transfer rate, as well as data from other states with open enrollment programs, demonstrate that transfer volatility is not a concern. Transfer growth is gradual and linear, giving districts plenty of time to respond accordingly.
Conclusion
Cross-district transfer data for Wisconsin, Kansas, and West Virginia, the only states with universal cross-district open enrollment and comparable inaugural-year data available, show that sudden, unpredictable fluctuations in the number of transfer students are not a realistic concern.
To date, 16 states have enacted robust cross-district open enrollment programs, all without unleashing mass exoduses of students and funding from districts or collapsing districts under the weight of incoming transfer applications. Moreover, like all those states, New Hampshire’s SB 101 and HB 751 explicitly allow school districts to determine their own capacity for enrolling transfer students, ensuring that no district must accept more students than it can serve with existing staff and facilities.
But while open enrollment poses little risk of disruption, the benefits are substantial. Even at modest participation rates, hundreds of New Hampshire families would gain access to public schools that better fit their children’s needs, allowing them to enroll in higher-rated school districts, pursue advanced or specialized coursework, access smaller class sizes, escape bullying, shorten their commute to school, and make other choices in the student’s best interests. As other states have shown, the number of students using open enrollment grows steadily over time, extending the benefits for students and families across the state year over year. In doing so, such an open enrollment program would also incentivize New Hampshire’s public schools to improve and innovate to attract students, and the generous funding that would follow them. Open enrollment is far from a wrecking ball. It is a policy that helps schools and families, serving as a release valve for students stuck in public schools that are not the right fit, allowing them to choose other public schools that better meet their needs.