

As California’s community colleges strive to attract students and keep fees low, many are struggling with their high pension and bond costs.
In addition to paying debt service on their bonds and making ever-growing pension contributions, these institutions must also fulfill their retiree health insurance obligations. And a new government accounting standard is bringing new attention to these other post-employment benefits (OPEBs) and the wide variance in how community college districts are handling them.
Replacing Government Accounting Standards Board (GASB) Statement 45, GASB Statement 75 modified and streamlined disclosure of future non-pension benefits, requiring a reporting entity to recognize its full OPEB liability in its financial statements rather than just mentioning the amount in a footnote.
According to a Reason Foundation analysis of audited financial statements, as of the 2018 fiscal year, the California community college system had approximately $1.4 billion in OPEB assets and over $4 billion in OPEB liabilities, leaving the system with $2.7 billion in unfunded other post-employment benefit liabilities.
Community College District OPEB Liabilities per FTES
| District Name | Unfunded OPEB Liability | Full-Time Equivalent Students—FTES | Unfunded OPEB Liability per FTES |
|---|---|---|---|
| Antelope Valley Community College District | $6,139,627.00 | 11,069.41 | $554.65 |
| Butte-Glenn Community College District | $3,127,773.00 | 11,210.15 | $279.01 |
| Cabrillo Community College District | $10,476,676.00 | 9,543.93 | $1,097.73 |
| Cerritos Community College District | $21,233,167.00 | 17,747.48 | $1,196.40 |
| Chabot-Las Positas Community College District | $191,285,336.00 | 16,934.83 | $11,295.38 |
| Chaffey Community College District | $4,441,296.00 | 16,816.61 | $264.10 |
| Citrus Community College District | $2,700,290.00 | 12,616.26 | $214.03 |
| Coast Community College District | $32,148,748.00 | 37,580.51 | $855.46 |
| College of the Sequoias Community College District | $1,891,277.00 | 10,123.43 | $186.82 |
| Compton Community College District | $9,027,061.00 | 4,956.19 | $1,821.37 |
| Contra Costa Community College District | $138,768,693.00 | 30,158.11 | $4,601.37 |
| Copper Mountain Community College District | $1,292,736.00 | 1,679.61 | $769.66 |
| Desert Community College District | $3,312,989.00 | 9,969.85 | $332.30 |
| El Camino Community College District | 2,749,057 | 18,423.25 | $149.22 |
| Feather River Community College District | $2,172,082.00 | 1,963.12 | $1,106.44 |
| Foothill-DeAnza Community College District | $91,268,327.00 | 29,642.94 | $3,078.92 |
| Gavilan Community College District | $1,841,028.00 | 5,198.11 | $354.17 |
| Glendale Community College District | $21,641,200.00 | 14,465.51 | $1,496.06 |
| Grossmont-Cuyamaca Community College District | $13,073,951.00 | 16,960.44 | $770.85 |
| Hartnell Community College District | $956,562.00 | 7,406.97 | $129.14 |
| Imperial Community College District | $63,451,633.00 | 7,954.03 | $7,977.29 |
| Kern Community College District | $17,217,811.00 | 23,225.36 | $741.34 |
| Lake Tahoe Community College District | $1,147,872.00 | 3,150.50 | $364.35 |
| Lassen Community College District | $237,806.00 | 1,786.49 | $133.11 |
| Long Beach Community College District | $34,727,328.00 | 19,995.46 | $1,736.76 |
| Los Angeles Community College District | $591,811,439.00 | 95,742.43 | $6,181.29 |
| Mendocino-Lake Community College District | $5,856,986.00 | 2,893.83 | $2,023.96 |
| Merced Community College District | $56,801,302.00 | 9,711.38 | $5,848.94 |
| MiraCosta Community College District | $3,118,738.00 | 11,557.41 | $269.85 |
| Monterey Peninsula Community College District | $6,924,263.00 | 6,268.82 | $1,104.56 |
| Mt. San Antonio Community College District | $51,816,293.00 | 33,945.00 | $1,526.48 |
| Mt. San Jacinto Community College District | $7,051,039.00 | 11,882.93 | $593.38 |
| Napa Valley Community College District | $41,900,555.00 | 5,235.03 | $8,003.88 |
| North Orange County Community College District | $9,452,093.00 | 39,936.90 | $236.68 |
| Ohlone Community College District | $1,405,197.00 | 8,504.58 | $165.23 |
| Palo Verde Community College District | $970,647.00 | 2,100.21 | $462.17 |
| Palomar Community College District | $96,378,790.00 | 19,345.66 | $4,981.93 |
| Pasadena Community College District | $20,843,699.00 | 26,229.74 | $794.66 |
| Peralta Community College District | $203,378,811.00 | 20,306.76 | $10,015.33 |
| Rancho Santiago Community College District | $167,278,154.00 | 32,078.34 | $5,214.68 |
| Redwoods Community College District | $6,362,033.00 | 3,965.99 | $1,604.15 |
| Rio Hondo Community College District | $37,372,122.00 | 13,624.46 | $2,743.02 |
| Riverside Community College District | $44,444,588.00 | 31,114.69 | $1,428.41 |
| San Bernardino Community College District | $1,767,948.00 | 16,045.45 | $110.18 |
| San Diego Community College District | $13,952,210.00 | 44,986.11 | $310.14 |
| San Francisco Community College District | $126,487,856.00 | 22,175.11 | $5,704.05 |
| San Joaquin Delta Community College District | $85,474,364.00 | 14,148.84 | $6,041.09 |
| San Luis Obispo County Community College District | $757,413.00 | 7,979.75 | $94.92 |
| San Mateo County Community College District | $6,150,492.00 | 21,186.98 | $290.30 |
| Santa Barbara Community College District | $7,470,102.00 | 15,058.12 | $496.08 |
| Santa Clarita Community College District | $13,365,190.00 | 16,289.70 | $820.47 |
| Santa Monica Community College District | $84,493,868.00 | 24,941.72 | $3,387.65 |
| Shasta-Tehama-Trinity Community College District | $24,418,637.00 | 6,972.94 | $3,501.91 |
| Sierra Joint Community College District | $34,617,347.00 | 14,449.06 | $2,395.82 |
| Siskiyou Joint Community College District | $5,447,057.00 | 2,472.62 | $2,202.95 |
| Solano Community College District | $9,821,276.00 | 7,307.68 | $1,343.97 |
| Sonoma County Community College District | $31,583,452.00 | 19,365.42 | $1,630.92 |
| Southwestern Community College District | $13,835,313.00 | 14,530.50 | $952.16 |
| State Center Community College District | $40,335,833.00 | 31,386.24 | $1,285.14 |
| Ventura County Community College District | $175,777,667.00 | 27,970.22 | $6,284.46 |
| West Hills Community College District | $4,788,313.00 | 5,929.39 | $807.56 |
| West Kern Community College District | $16,587,467.00 | 2,889.06 | $5,741.48 |
| Yosemite Community College District | $6,480,409.00 | 14,926.76 | $434.15 |
| Allan Hancock Community College District | -$1,233,320.00 | 10,053.89 | -$122.67 |
| Barstow Community College District | -$2,080,898.00 | 2,522.08 | -$825.07 |
| Los Rios Community College District | -$9,609,706.00 | 52,173.51 | -$184.19 |
| Marin Community College District | -$1,370,076.00 | 3,715.89 | -$368.71 |
| San Jose-Evergreen Community College District | -$10,587,811.00 | 12,789.32 | -$827.86 |
| South Orange Community College District | -$5,832,855.00 | 27,045.93 | -$215.66 |
| Victor Valley Community College District | -$305,705.00 | 9,369.60 | -$32.63 |
| West Valley-Mission Community College District | -$6,946,780.00 | 11,877.33 | -$584.88 |
| Yuba Community College District | $47,809,628.00 | 7,713.21 | $6,198.41 |
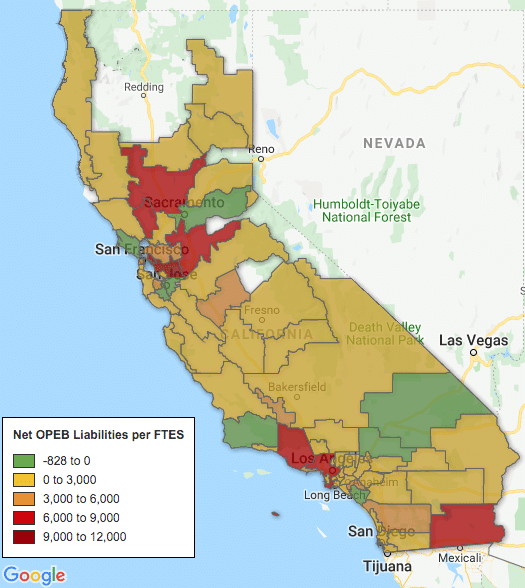
To visualize the significance of unfunded OPEB liabilities for each district, Reason Foundation built a map of unfunded OPEB liabilities per full-time equivalent student (FTES). As the map demonstrates, some districts are bearing greater unfunded liabilities per full-time student than others.
The way in which individual districts have addressed their unfunded OPEB liabilities also varied.
By establishing an irrevocable other post-employment benefits trust, community districts can pre-pay for non-pension employee benefits, which allows them to harness the power of compound interest to maximize funds and reduce costs. In California’s system, 61 of 72 community college districts have established a trust, meaning a majority of districts have taken an important first step toward fiscal sustainability. The argument for pre-funding OPEBs is the same as the argument for pre-funding pensions — these benefits are earned by employees while they are working and by failing to set aside funds for these benefits at the time they are earned, the financial responsibility for them is shifted onto future taxpayers, students and employees, who, as a result, may face higher taxes, lower educational quality or reduced benefits as they pay the bills for these retirement benefits.
The immediate question arises as to what has happened to the districts that have not opted for a trust. Unsurprisingly, every district that has forgone the establishment of a trust also carries a significant unfunded OPEB liability. Districts without a trust had an average unfunded OPEB liability of $47.4 million. In comparison, community college districts with an other post-employment benefits trust had an average of $36.4 million.
Two prominent examples making the list are Chabot-Las Positas Community College District and Peralta Community College District. In 2018, Chabot-Las Positas and Peralta reported unfunded OPEB liabilities in the amount of $191.2 million (or $11,295 per full-time equivalent student) and $203.3 million ($10,015 per FTES) respectively. Not pre-funding their OPEBs generates difficult contribution and funding decisions for these districts, which are likely major contributors to their current unfunded liabilities.
Simply establishing a trust, however, does not necessarily guarantee advance contributions are sufficient for full funding. Some districts utilize their trusts to fully pre-fund promised OPEB benefits, others haven’t been able to. Among the group of full-funders, Allan Hancock Joint Community College District is a noteworthy example. According to its 2018 Annual Financial Report, the district contributed over $1 million to its OPEB trust. Its plan’s fiduciary net position, as a percentage of total OPEB liability, was 115.88 percent. This means that Hancock has more than enough money to pay out all of the retirement benefits it has promised to employees, according to actuarial recommendations.
Two other districts are not currently at full funding but are close. In 2018, Citrus Community College District and North Orange County Community College District reported a fiduciary net position as a percentage of total OPEB liability at 85.84 percent and 92.07 percent, respectively.
Many community college districts have yet to pre-fund their trusts thus providing OPEBs on a pay-as-you-go basis. These districts contribute to their trusts only to make benefit payments of an equivalent amount. There are also a few districts forgoing full pre-funding contributions to trusts for the moment because their plans have a funded ratio exceeding 100 percent. For example, Barstow Community College District boasts a 206.38 percent funded ratio.
Functionally, with regard to carrying large OPEB obligations, there’s difficulty in telling the difference between districts with pay-as-you-go trusts and districts with no trust at all. For instance, Ventura Community College District reported net OPEB liabilities totaling nearly $175 million, or $6,284 per FTES, with only 10.14 percent of that amount available in assets. Palomar Community College District fared worse. Its net OPEB obligations totaled $96.3 million, or $4,981 per FTE, while its funded ratio stood at just 4.44 percent. These districts are simply underutilizing the primary method they have to pre-fund for future OPEB benefits. Without sufficient assets to offset liabilities, their trusts are structured to pre-fund benefits but are essentially falling into a pay-as-you-go method.
The analysis also finds that a subset of districts is not directly contributing to their trusts at the moment, despite the fact that they are still paying benefits. Marin Community College District’s OPEB plan was 164.85 percent funded and had a net OPEB asset of $368 per FTES, which affords the option of drawing down its fiduciary net position. Kern County Community College District and San Jose-Evergreen Community College District have opted to issue debt in the form of OPEB obligation bonds to pay for their benefits.
Reason Foundation’s map shows how deceiving this can be. According to the map, San Jose-Evergreen has the highest net OPEB asset per FTES in the entire community college system. If it were not known that these assets are boosted by bonds (just another form of public debt), it would appear that the district is in excellent fiscal standing. But the reality of the situation differs. The issuing institutions, Kern County and San Jose-Evergreen, have effectively transferred financial risk from the pooled assets of their plans to themselves. Both districts must now manage the risks associated with the debt service of their bonds.
In the case of San Jose-Evergreen, the district’s newly acquired risks could lead to financial complications. San Jose-Evergreen’s 2018 financial report notes it has opted for OPEB taxable bonds which “mature through June 1, 2044, and bear a variable interest rate with an initial LIBOR Index Rate Period ending on April 30, 2027, subsequent to which the District can elect various rate methods with a maximum rate of 12 percent.”
Given the recent uncertainty in financial markets, time will tell whether its exposure to long-term interest rate risk will pay off.
Reason Foundation’s analysis reveals some individual community college districts are falling well short of paying for their other post-employment benefit obligations, while other districts have successfully generated enough in assets to live up to their promises in full. Generally speaking, the community college districts that have set up a trust and have pre-funded benefits tend to have a higher chance of being fully-funded.