

This column is the fifth and final in a series examining Arkansas’s K-12 education funding system and the state legislature’s biennial adequacy review process (Here are the first, second, third, and fourth posts). The series analyzes how Arkansas got its current education funding system, how it works, and what components policymakers should improve to achieve a modernized education funding formula that is better for students and more amenable to education choice.
Wrapping up the adequacy review
As the adequacy review draws to a close, both the Arkansas House and Senate Education Committees are deliberating and drafting final recommendations to update the state funding formula for the 2025-2027 biennium. Drafts were due on Oct. 16, and final reports are due to the Senate President Pro Tempore and Speaker of the House on Nov. 1, 2024. While these final reports have traditionally generated only small tweaks in the matrix—the state’s main funding formula—the findings will also impact larger formula reform proposals during the 2025 legislative session.
Key education finance reforms for Arkansas to pursue
Earlier installments of this series presented K-12 funding trends that emerged from the state’s annual statistical reports and summarized the key findings from Arkansas’s biennial adequacy reports. In short, these reviews highlighted that while Arkansas has a relatively streamlined funding system, property wealth still has a greater impact on revenue allocation than student needs. Additionally, the state’s adequacy reports highlight that the matrix—the state’s primary funding formula—has changed little since its adoption in 2003. It is simplistic in some of its assumptions around individual student needs.
To address these shortcomings, Arkansas policymakers should (1) collapse the state’s categorical grants into a weighted-student formula, (2) more accurately account for low-income and special education populations, and (3) preserve the existing student-centeredness and flexibility of the current formula.
Adopt weighted student funding
Arkansas already has some core elements needed to build a weighted student formula, which is the practice of establishing a base per-student amount and adding weight multipliers that augment funding for higher-need students. Under the current system, each student already receives a base dollar amount. Additionally, the state has several categorical grants that allocate additional per-student amounts for students from low-income families (between $538 and $1,613 per qualifying student, depending on poverty concentration) and English learners ($366 per qualifying student).
However, too many state grants divert funds away from the core goal of the state funding formula, which is to provide general education funds based on student counts and leave spending decisions largely to local leaders. State grants outside of the matrix comprise 15.3% of state and local education dollars, or $815.9 million. While some of them are based on student characteristics, many others are for items like teacher professional development, declining enrollment, and other purposes that often come with spending restrictions and reporting requirements.
Arkansas policymakers can improve their funding system by collapsing most or all these separate grants into the state funding formula. Funding streams geared toward higher-need students should be converted into weights that augment per-student amounts for those student populations and that are mixed in with general formula funds. Fully adopting weighted student funding would simplify budgets for district and charter school leaders, increase flexibility and transparency, ease reporting requirements, and tie funding more directly to student counts and individual student needs. Additionally, re-formatting these separate grants as weights would ensure that any future increases in formula funding also translate to additional support for higher-need students.
More accurately account for students from low-income families
Effective adoption of weighted student funding also requires better measurement and funding of students in specific higher-need categories. Enhanced Student Achievement Funding—Arkansas’s largest categorical grant for students in low-income households—has two main problems.
First, it uses outdated and inaccurate measures of economic disadvantage because it is based on students who qualify for the federal free and reduced-price lunch (FRPL) program. Because of several federal programs that allow many school districts to receive federal school lunch subsidies without collecting any FRPL applications or to collect them less frequently, many school districts do not have up-to-date counts of FRPL students. While the state tries to work around this problem by using FRPL counts taken prior to districts entering these federal arrangements, the counts are now nearly a decade old in many districts. Beyond being outdated, using FRPL as a poverty measure can lead to inflated poverty counts because income thresholds for the program are above the federal poverty line. As a result of both outdated and inflated counts, more than half of the state’s districts have FRPL counts of over 70% of their student population.
A second major problem with Arkansas’s Enhanced Student Achievement grant is that it sorts school districts into three tiers based on the percentage of their FRPL students. The lowest tier is for districts with less than 70% FRPL students and uses a multiplier of $538 per FRPL student. For districts between 70 and 90% FRPL, the multiplier is $1,076 per FRPL student. For districts over 90% FRPL, the multiplier is $1,613 per FRPL student. Problematically, these dollar multipliers are applied to all FRPL students in a district so that a district could stand to lose or gain substantial funding if they move from one tier to another. It also leads to districts with similar poverty rates receiving very different levels of support from the grant.
The consequence of the flawed poverty measures and the steep funding cutoffs is poor resource targeting for students from low-income families (see Figure 1).
Figure 1: Enhanced Student Achievement Funding vs. U.S. Census Child Poverty Rates
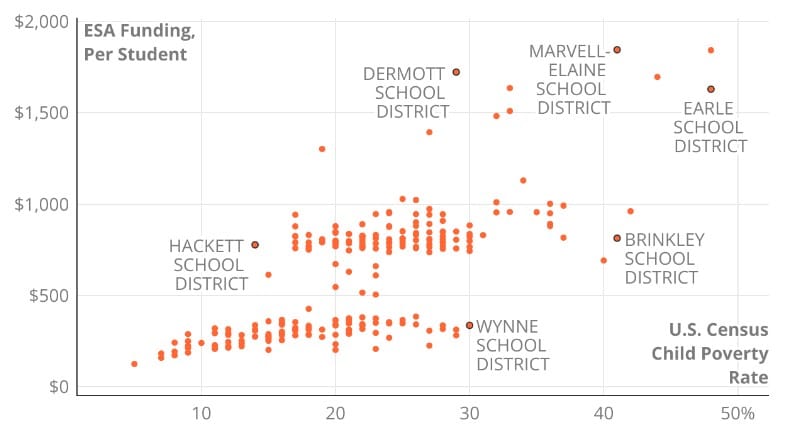
Figure 1 illustrates the strange funding patterns that result from these flawed mechanisms. Instead of FRPL counts, the x-axis displays estimated percentages of children in low-income households as measured by the U.S. Census Bureau. The clustering of districts in the $200-$400 per-student range and the $700-$1,000 per-student range is a result of the FRPL funding cliffs. However, also notice that those tiers often don’t track closely with the poverty rates as measured by the Census Bureau. For instance, Dermott and Wynne—despite having similar federal poverty rates of 29% and 30% respectively—have an Enhanced Student Achievement funding gap of $1,386 per student favoring Dermott (includes all students, not just low-income).
To more fairly fund low-income students, the state should move away from FRPL counts and use a method like direct certification, where states individually verify family income status through their participation in federal means-tested programs such as the Supplemental Nutritional Assistance Program or other programs where proof of need is family-specific and up to date. This reform was adopted by Massachusetts in 2015, and it allowed the state to better target funds to low-income students. Enhanced Student Achievement funds should also be converted to a single formula weight so that the funding cliffs are eliminated and all low-income students are treated more fairly.
More accurately account for special education students
Arkansas’s funding formula also has simplistic assumptions for special education (SPED) students. Instead of funding SPED students through a separate funding stream, the matrix assumes school districts need 2.9 special education teachers for every 500 students or $441 per student. This methodology is flawed because it doesn’t recognize differences in either the proportion or severity of disabilities across school systems. The average Arkansas district has 14.1% of students identified as SPED. However, those rates vary significantly across districts from 1% to 26%. Districts also have different profiles in types of disabilities—e.g., some have large shares of students with speech and language impairments, and others have high shares of students with autism.
To be sure, the state does have reimbursement funding for high-cost SPED students for student expenses above $15,000, but those reimbursements aren’t a reliable way to differentiate by disability severity because they aren’t guaranteed, and districts have to submit detailed claims to get them.
Instead of providing a flat per-student amount for special education, Arkansas should adopt an approach used by many other states. It should adopt funding weights based on the actual counts of SPED students and differentiate them based on the degree of additional services they need. Florida, for example, places SPED students into multiple tiers based on how frequently they receive additional services. Students in higher tiers receive additional per-student funding amounts.
Preserve the student-centeredness and flexibility of the current formula
Arkansas’s matrix is a funding formula, not a spending formula. In other words, the state formula isn’t attempting to prescribe how districts should spend their formula dollars. While the matrix per-student amount is built on basic assumptions around the typical kinds of staff and inputs a school district needs, it would inhibit flexibility to force districts to spend funds in line with those assumptions. After all, state adequacy report data show that districts and charters frequently make expenditure decisions that depart from matrix assumptions, a good sign that local leaders exercise their ability to customize budgets. Adopting weighted student funding would build on this foundational principle, and any other reforms pursued by the legislature in the near term should maintain it.
Keeping dollars unrestricted and tying them more closely to individual student needs through weighted funding also benefits school choice. If the weights are applied to Arkansas’s new Education Freedom Account program—which allows families to take their education dollars to an educational setting of their choice—it would incentivize private schools and other providers to cater services to higher-need students. Similarly, higher-need students seeking to transfer across district lines or enroll in charter schools would also be treated more favorably.
Conclusion
Arkansas is in a good position to build on recent K-12 reform successes and pursue comprehensive school finance reform in the coming year. The state has leaders who are championing the issue. Rep. Bruce Cozart (R-Hot Springs) plans to sponsor a bill in the coming session, similar to one he advocated last year, that implements weighted student funding. The policy recommendations and analysis featured in this series could refine that effort.
Arkansas K-12 Education Finance Series