
This column is the second in a series examining Arkansas’s K-12 funding system and the state legislature’s biennial adequacy review process. The series aims to analyze how Arkansas got its current education funding system, how it works, and what components policymakers should improve to achieve a modernized education funding formula that is better for students and more amenable to education choice.
How Arkansas K-12 public schools are funded
Arkansas currently has 475,207 public school students enrolled in 237 school districts and 23 open enrollment charter schools. Over the decade before the pandemic, the state saw a modest 2% growth in public school enrollment. While enrollment dipped early in the pandemic below 470,000 students, it has since partially rebounded to where it was in the fall of 2019 at nearly 480,000 students.
As outlined in the first installment of this series, Arkansas’s current school finance system is largely a product of the Lake View litigation spanning from the 1990s to the mid-2000s and has changed little since the Arkansas Supreme Court resolved the case in 2007. While education funding in every state is complex, Arkansas enjoys a relatively streamlined and straightforward funding system.
Before explaining the basic mechanics of Arkansas’s K-12 finance system, it’s first helpful to see a summary of the state’s major revenue buckets for public schools. All revenue figures are from the 2022-2023 school year, the most recent year for which complete data is available. For clarity, public school districts and open enrollment charter schools will be displayed separately.
Table 1: School district revenues (state and local)
| Revenue Source | Amount | Percentage (State and Local) | |
| Local | Local matrix funding (URT revenue) | $1,502,048,738 | 28.1% |
| Local property tax receipts (excluding URT) | $771,008,261 | 14.4% | |
| Other local/intermediate receipts | $335,664,066 | 6.3% | |
| State, unrestricted | State matrix funding (foundation aid) | $1,914,115,849 | 35.9% |
| All other unrestricted state funding | $60,470,888 | 1.1% | |
| State, restricted | Enhanced student achievement | $232,587,938 | 4.4% |
| All other education, students with additional needs | $106,829,224 | 2.0% | |
| All other regular education | $225,298,767 | 4.2% | |
| Other Sources | Financing, gain/loss of assets, other | $190,663,408 | 3.6% |
| TOTAL | $5,338,687,138 |
As Table 1 shows, matrix funding comprises 64% of all state and local funding in Arkansas school districts, additional local property taxation and local receipts comprise the next 20.7%, and the remaining revenue is comprised of state-restricted and unrestricted grants.
Table 2: Charter school revenues (state and local)
| Revenue Source | Amount | Percentage (State and Local) | |
| Local | Local receipts (non property-tax) | $12,867,377 | 5.6% |
| State, unrestricted | State matrix funding (foundation aid) | $184,392,872 | 79.9% |
| All other unrestricted state funding | $6,229,822 | 2.7% | |
| State, restricted | Enhanced student achievement | $8,242,159 | 3.6% |
| All other education, students with additional needs | $1,459,598 | 0.6% | |
| All other regular education, misc. | $15,676,291 | 6.8% | |
| Other Sources | Financing, gain/loss of assets, other | $1,992,927 | 0.9% |
| TOTAL | $230,861,047 |
Table 2 shows the major revenue buckets for Arkansas’s 23 open enrollment charter schools. These figures do not include district conversion charter schools, which are included in Table 1.
The matrix
Recall that the matrix formula is based on staffing and cost assumptions and evaluated by state experts and the legislature in Arkansas’s biennial adequacy reviews. It establishes a uniform per-student amount that each district will receive. In the 2022-2023 school year that amount was $7,413 per student. The matrix is also a foundation funding formula, meaning it funds school districts with a mixture of state and local funds and equalizes differences in local property wealth between districts. Most states employ some form of foundation formula for school funding.
To contribute to the matrix in Arkansas, all school districts must levy a uniform tax rate (URT) of 25 mills. A mill is equal to $1 in local tax revenue raised for every $1,000 of assessed property wealth and that assessment includes real, personal, and utility property. Due to differences in property valuations across districts, the 25-mill URT covers varying shares of each district’s total matrix funding.
Once it’s determined how much each school district is estimated to raise from the URT, the state supplements each district’s URT with state equalization aid to guarantee that each district receives $7,413 per student.
State grants
Because the matrix foundation formula does not account for most categories of higher-need students, Arkansas has four major state categorical grants targeted largely to students in these groups (all totals include both school districts and charter schools):
1. Alternative learning environment (ALE)
This grant is intended for students who spend time outside of standard classrooms in alternative learning environments, such as those with special needs or other academic or behavioral challenges. Grant amounts are based on the amount of time students spend in alternative classrooms with a multiplier amount of $4,890 per student. Total ALE funding in 2022-2023 was $31.2 million.
2. English language learners (ELL)
This grant is intended for students who aren’t proficient in English. It employs a flat multiplier of $366 per identified ELL student and totaled $14.7 million in 2022-2023.
3. Professional development (PD)
This grant funds district-level professional development programs for school staff. It employs a flat multiplier of $37.50 per student and totaled $17.7 million in 2022-2023.
4. Enhanced student achievement (ESA)
This grant directs additional funds for low-income students who qualify for free or reduced-price lunch (FRPL). The grant sorts districts into three tiers depending on the overall proportion of their students who qualify for FRPL and uses different aid multipliers in each tier, which are multiplied by a district’s total enrollment. The lowest tier is for districts with less than 70% FRPL students and uses a multiplier of $538 per student. For districts between 70 and 90% FRPL, the multiplier is $1,076 per student. For districts over 90% FRPL, the multiplier is $1,613 per student. ESA funding totaled $240.8 million in 2022-2023.
In addition to the four main categorical grants, Arkansas has restricted grants for gifted and talented student programs, career education, and for other purposes. Beyond the state’s restricted grants, Arkansas has several small unrestricted grants for districts seeing substantial enrollment increases or decreases, for bonded debt assistance, for isolated school districts, and for other purposes.
Other local revenues
While every school district in Arkansas imposes the uniform tax for the state funding formula, most districts raise additional funds from voter-approved local mills. Additional mills often service debt for bonds that fund facility improvements and construction. Debt service mills are imposed by 231 of Arkansas’s 234 regular school districts and range from as little as 1.3 mills to 29.8 mills. Arkansas school districts also sometimes levy additional property taxes for operations. In the 2022-2023 school year, 61 regular districts levied additional mills for maintenance and operations, ranging between 0.12 mills to 10 mills. Arkansas school districts raise about $771 million from these other local revenue sources.
Allocation trends
When excluding federal funds, Arkansas has a slightly progressive funding system—meaning that students in low-income households receive modestly more funding (1% more) on average than students in non-low-income households. According to the Urban Institute, Arkansas is above the national average in funding progressivity. The primary drivers of this allocation trend are the additional funding allocated to low-income students through the state’s enhanced student achievement grants and the fact that low-income students aren’t overly concentrated in districts with low property wealth. Figure 1 summarizes this trend for higher-poverty and lower-poverty school districts. Charter schools are excluded since they do not have residential boundaries and reliable federal poverty data. Poverty figures are drawn from the latest Small Area Income and Poverty Estimates for school districts published by the U.S. Census Bureau.
Figure 1: Arkansas Per Student Funding, Higher Poverty and Lower Poverty Districts
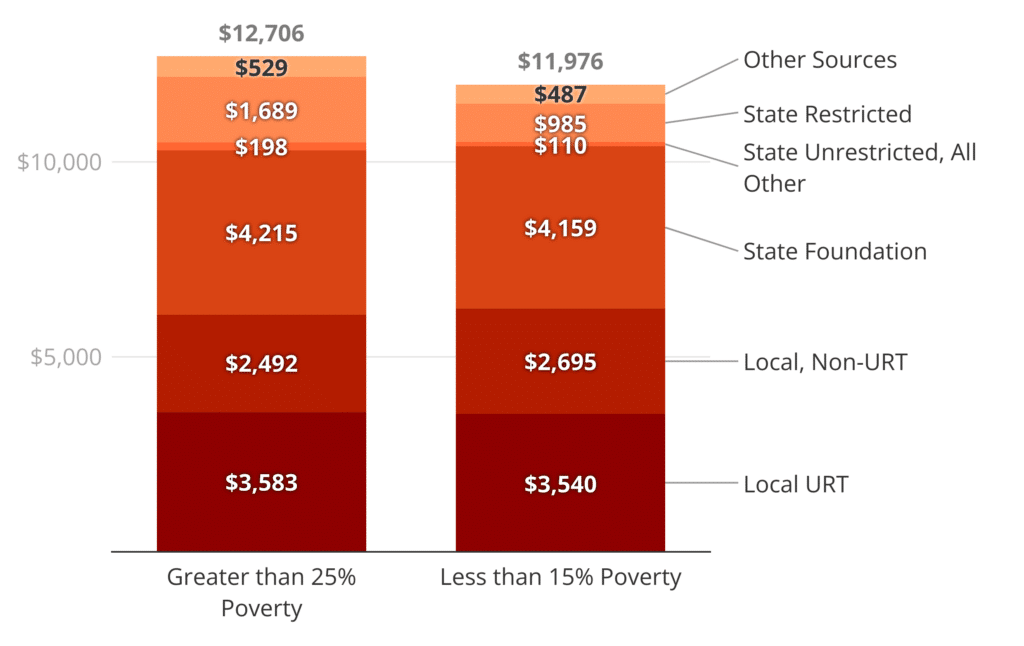
As Figure 1 illustrates, school districts with 25% or more students in poor households receive $729—or 5.7%—more per student than districts with 15% or less students in poverty. For reference, the average childhood poverty rate in Arkansas is 18.8%. Most of the additional funding for higher-poverty districts comes from state-restricted funding and the largest grant in that category is enhanced student achievement funding, which is intended to provide higher funding for low-income students and higher concentrations of low-income students.
While the prevalence of students from low-income households has a modest impact on district funding distributions, variations in district property wealth have a more pronounced effect on allocation patterns.
Figure 2: Arkansas Per-Student Funding, Higher Property Wealth and Lower Property Wealth Districts
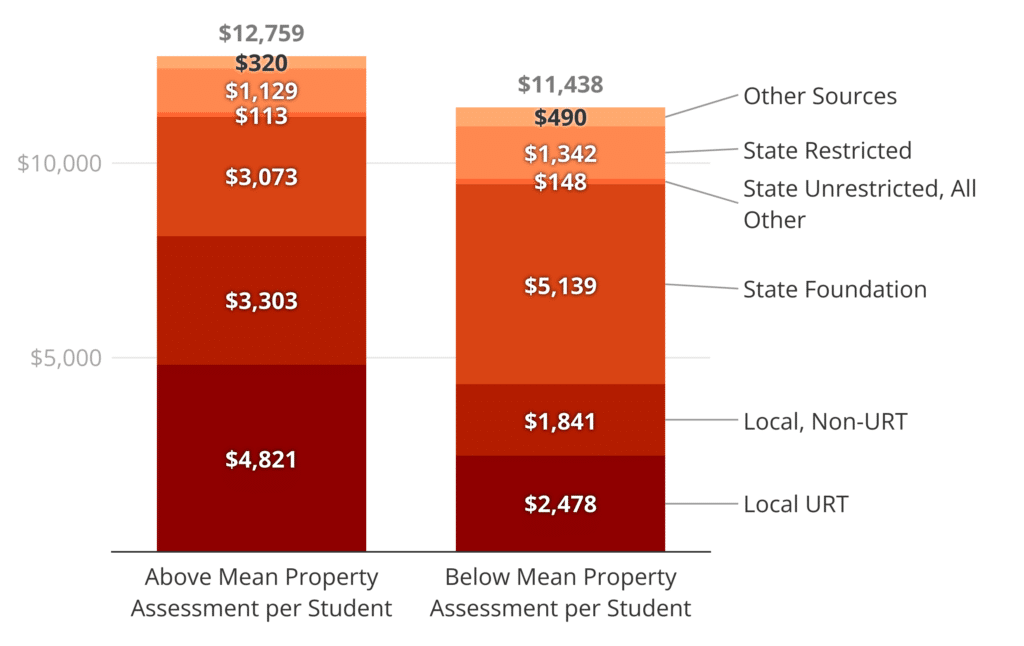
Figure 2 demonstrates that school districts below the state average district property assessment per student—or less property wealth per student—receive $1,320 less (10.3% less) per student than districts above the mean property assessment. Notice that lower-wealth districts receive more from state foundation aid and less from local URT funds because the foundation formula is designed to equalize differences in property wealth across districts.
Most of the disparity between the two district groups in Figure 2 is explained by additional non-URT local funds that higher-wealth districts raise through voter-approved property tax overrides to pay for bonds and supplement district operations. While some of the non-URT local funding disparity is offset by the fact that lower-wealth districts receive more per student from state-restricted funding, voter-approved local tax overrides still determine much of the funding disparities between districts in Arkansas.
Summary observations
1. Arkansas has a relatively streamlined and flexible funding system.
A substantial share—about two-thirds—of all state and local K-12 funding is allocated through the state foundation formula. Additionally, only 10.6% of funds come from state-restricted grants, and those restricted grants still provide district officials reasonable flexibility with how the funds may be spent. The state could further streamline the funding system by collapsing restricted grants into the formula and treat those funds instead as funding weights, which would further equalize funding between districts based on local taxing capacity and provide some more flexibility. Future additions in this series will explore how Arkansas can make further improvements.
2. Property wealth has a greater impact on revenue allocation patterns than student needs.
While Arkansas does provide additional funding for higher-need students through some of the state’s restricted grants, 20.7% of K-12 funding comes from local revenue sources outside of the foundation formula. Problematically, these local funds exert a greater impact on allocation patterns than state grants for special education, low-income, an English-learner students.
The next installment of this series will examine the state adequacy report findings thus far, focusing on the funding patterns highlighted by the revenue allocation reports, the best practices sections of those reports, and the impact of the LEARNS Act legislation from 2023.