


Introduction
Arizona, like many states, has an unfair and disjointed school funding system. Varying degrees of property wealth across the state results in education funding inequities and often leads to disadvantaged students not getting their fair share of the state’s education resources.
To help policymakers, educators and parents see these funding inequalities, Reason Foundation’s education policy team has developed the Arizona School Finance Dashboard. This data dashboard gives users the ability to compare school districts’ per-pupil revenue against student demographics and property wealth.
You can find the full interactive dashboard here: Arizona School Finance Dashboard.
The six tabs or pages on the Arizona School Finance Dashboard detail various categories and trends that are crucial to uncovering the education funding problems that plague Arizona’s most disadvantaged students.
This commentary will chronologically describe each page of the dashboard and the data trends it contains. By highlighting important school district comparisons and explaining overall funding patterns, we present key takeaways for policymakers and other stakeholders. It should be noted that the revenue data displayed excludes all federal funding that may also go to Arizona’s public school districts.
Revenue by Student Demographics
The first tab of the Arizona School Finance Dashboard provides a scatter plot of per-pupil revenue on the y-axis and a student demographic variable on the x-axis.
Users are able to select demographic variables like student poverty rate, ethnicity, special education student count, and English language learners as a percentage of school district population to see how these factors compare to per-pupil revenue distributions.
One of the keys things that this scatter plot shows is the general downward trend in per-pupil revenue as district poverty rates increase.
You can see this pattern in Figure 1 below.
Figure 1
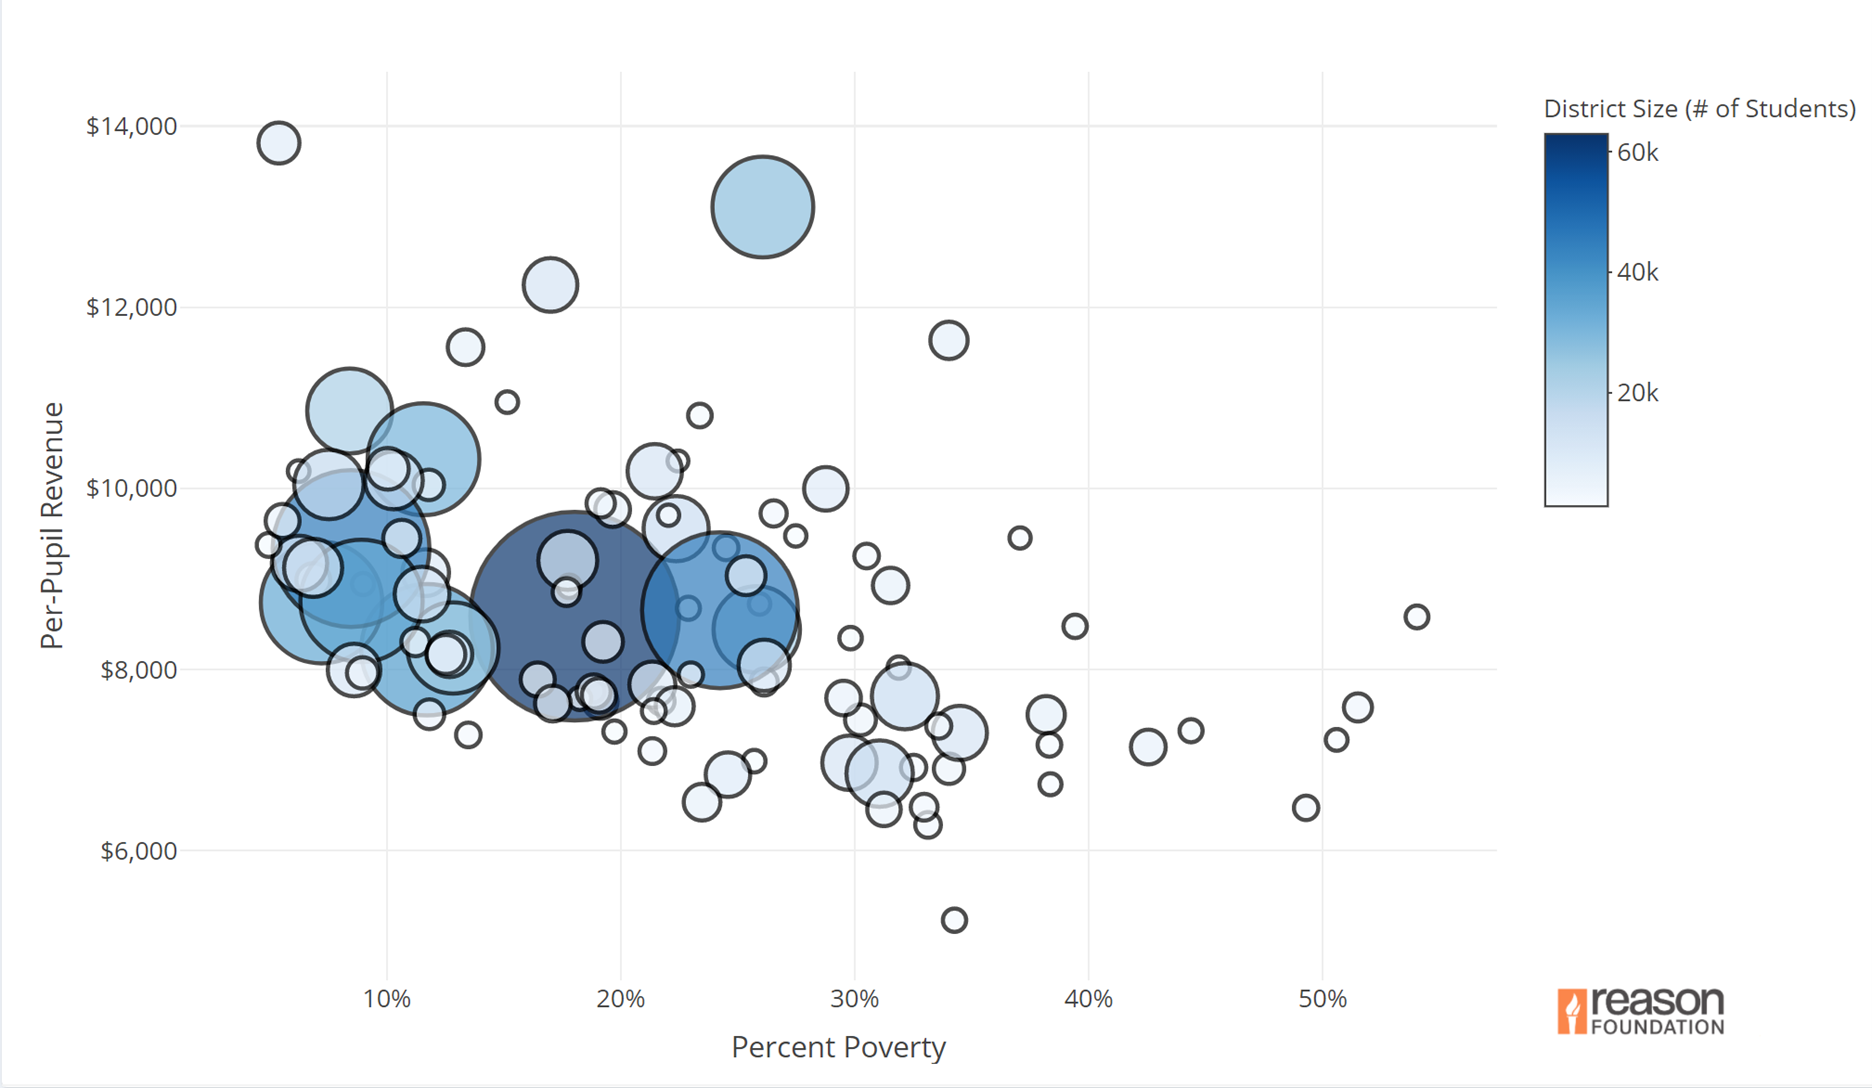
Paradise Valley Unified School District and Washington Elementary School District are examples of this trend. The school districts are both located in the area surrounding downtown Phoenix and are separated by less than 20 miles. Paradise Valley has 31,023 students and an 11.57 percent poverty rate. Paradise Valley received $10,321 in total per-pupil revenue and $7,524 in maintenance and operations per-pupil revenue last year.
Meanwhile, Washington Elementary had over double the number of students below the poverty rate of Paradise Valley last year—with 25.81 percent of their 22,682 students considered poverty level. But Washington Elementary received far less funding than Paradise Valley, with Washington Elementary receiving only $8,443 in total per-pupil revenue and $7,037 in maintenance and operations revenue.
There are three main reasons Arizona’s poorer school districts often receive less state and local revenues per student.
First, low-income students are more likely to be living in property-poor districts. This means that their school district has less access to additional local funds, which often come to schools via property taxes, for operations and facilities funding.
Second, Arizona has several state grants outside of its main education funding formula that distributes state dollars without accounting for the existing local resources. This includes state grants earmarked for teachers’ salaries, school safety programs, and other purposes. These state grants do not always take into account which school districts receive significant funds from local tax collection.
Third, Arizona is one of nine states in the country that does not allocate additional education funding for low-income students. This lack of a funding formula adjustment for economically-disadvantaged students makes students below the poverty level less likely to receive an adequate amount of state dollars.
Revenue by Student Demographics Table
The second tab of the dashboard allows users to view and download the raw, aggregated fiscal year (FY) 2019-2020 funding and student characteristic data for each school district in Arizona.
The data included in this table is what is used throughout the full Arizona School Finance Dashboard. In this tab, users are easily able to search for specific school districts within the data set.
Funding Quartiles by Student Demographics
This page aggregates Arizona’s per-pupil revenue data into quartiles based on school districts’ percentage of students in poverty. This aggregation is intended to display larger trends that may be difficult to see in the more granular scatter plots.
Figure 2
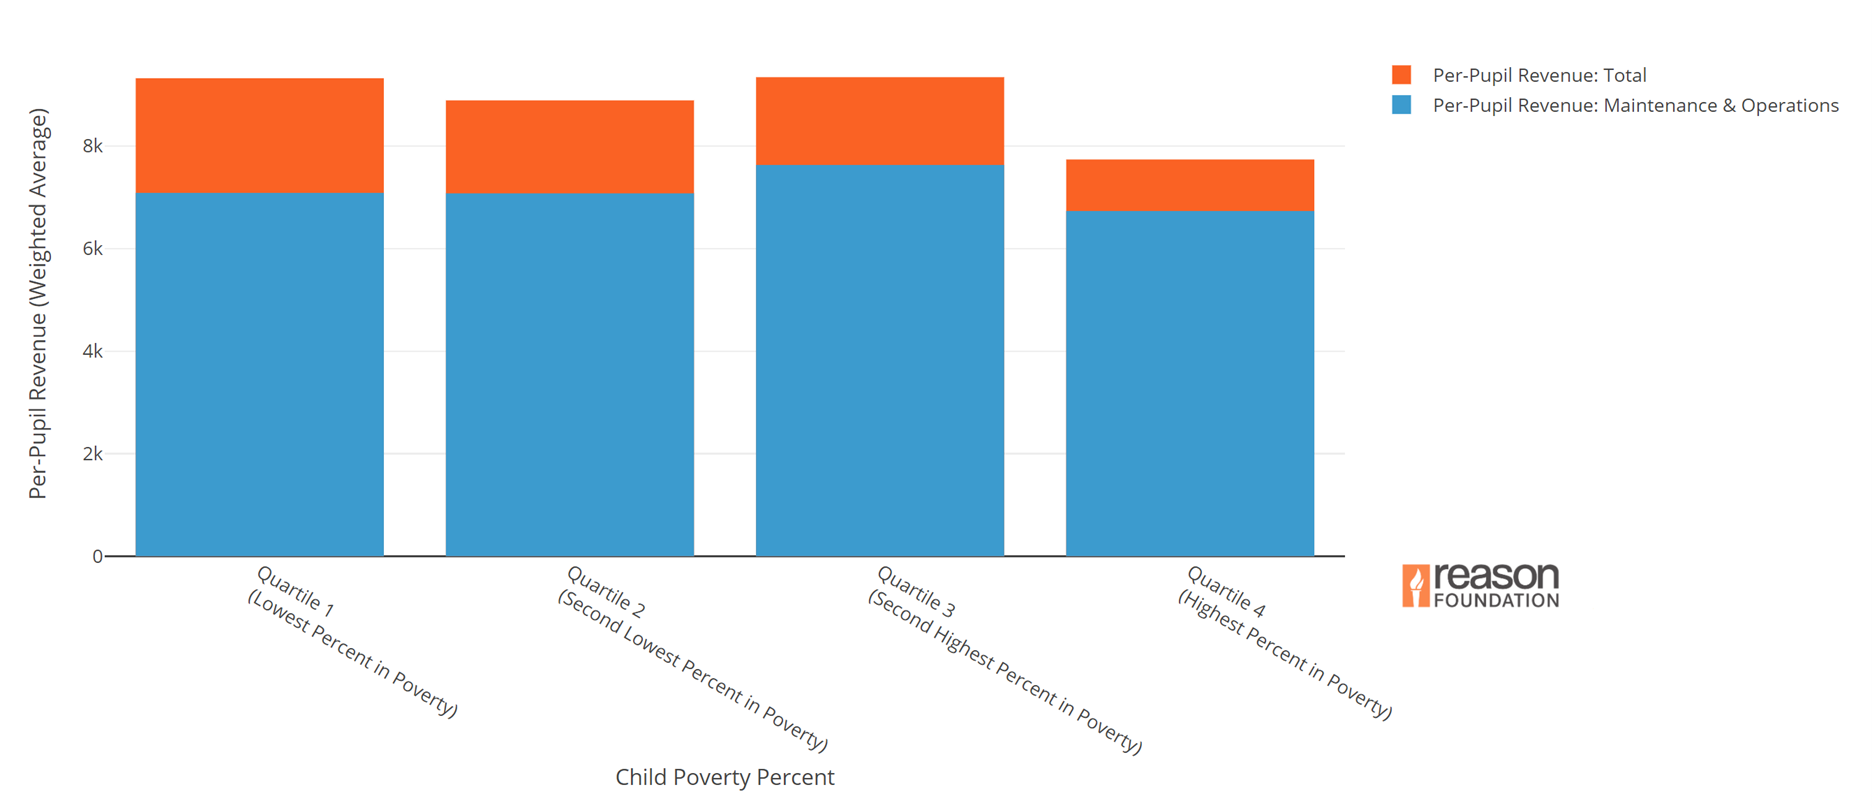
Figure 2 above shows that although a general negative correlation exists between per-pupil revenue and poverty levels, school districts with more low-income students do not always receive less state and local funds.
Quartiles one and four reiterate the pattern highlighted in the first tab and in the previous example. But as quartile three shows, some of the highest-funded school districts in the state have relatively high shares of economically-disadvantaged students. Moreover, this quartile chart also makes clear that funding inequities largely emerge only when all state and local revenues are factored in. When looking at maintenance and operations dollars only, there are smaller disparities between school districts of differing poverty rates.
Property Wealth and Funding
Page four of the dashboard illustrates the clearest school funding predictor in Arizona: property wealth.
This page provides a scatter plot of per-pupil revenue on the y-axis and per-pupil property wealth on the x-axis. The selection and filter options are the same as on the student demographic scatter plot. There is an additional tab that provides the cumulative property tax rates for districts.
Figure 3
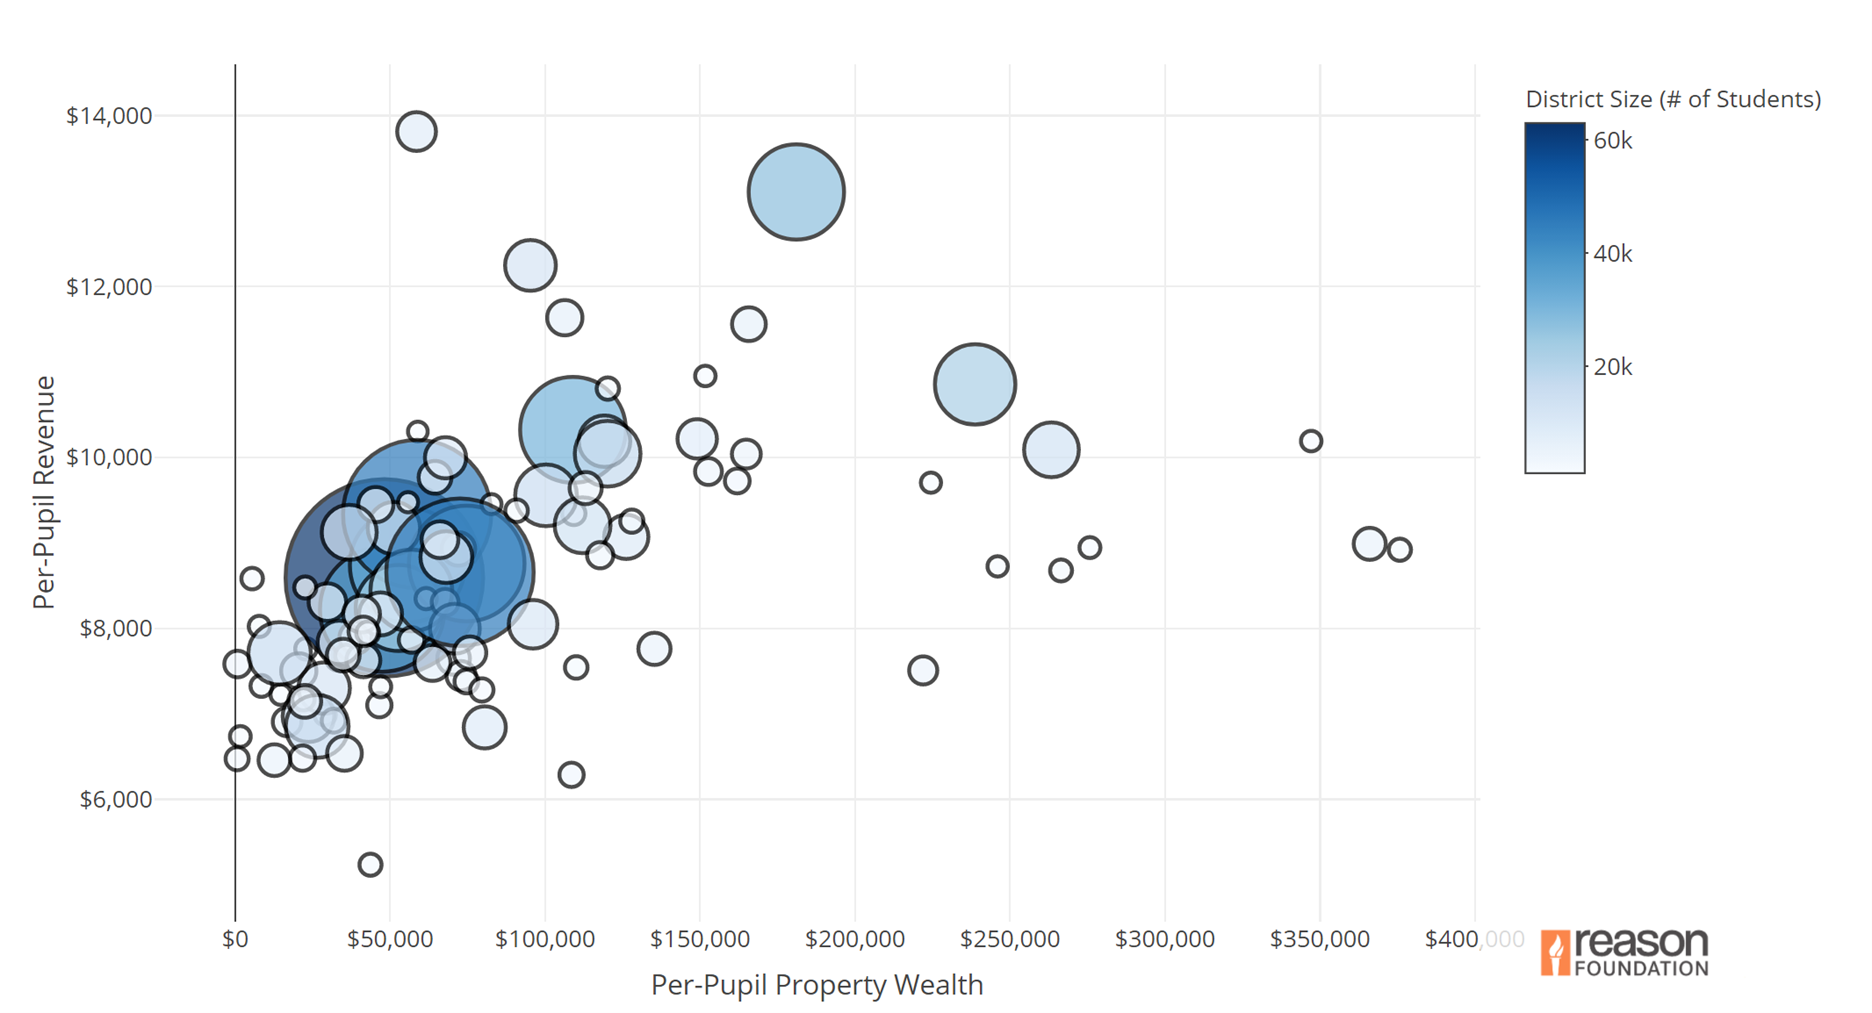
The scatterplot displayed in Figure 3 above reveals a strong positive correlation between per-pupil property wealth and per-pupil state and local revenues.
The disparity between property-wealthy Phoenix Union School District and property-poor Cartwright Elementary District in Glendale offers just one example of this overall trend. Phoenix Union’s per-pupil property wealth comes in at $181,052 and the school district receives $13,105 in per-pupil revenue.
On the other end of the spectrum is Cartwright, whose average property wealth is just $14,339 and its per-pupil revenue is $7,706, almost $5,000 less than Phoenix Union’s.
The major culprit behind these disparities is secondary taxes. In Arizona, secondary taxes are local taxes that can exceed primary tax rate caps and that are approved by local voters for district operations and bonds. Not only can districts with greater property wealth more easily levy secondary taxes, but they can also raise more funds with smaller secondary tax rates due to having larger tax bases.
Property Wealth and Funding – Page Four (Tab 2)
This chart displays the cumulative property tax rate of each district and how those rates relate to state and local funding per-pupil. As with the previous chart, this data further explains how varying degrees of property wealth can lead to funding disparities.
A school district’s cumulative property tax rate is the combination of both primary and secondary tax rates in Arizona. Primary taxes have capped rates and are levied to raise funds toward the state’s foundation formula. Secondary taxes are approved by voters to exceed the capped primary rates and raise additional funds for school operations and district-issued bonds.
Figure 4

The scatterplot above illustrates that school districts are taxing at widely different rates and, because of differences in property wealth, these rates do not share a clear relationship with state and local funding levels.
In fact, some districts with high cumulative tax rates still receive low funding. Cartwright and Phoenix Union again make this trend clear. Cartwright residents are taxed at a 12.7 percent rate while Phoenix Union families are taxed at 6.5 percent. Despite having double the tax rate, Cartwright receives almost $5,000 less in per-pupil revenue.
Funding Quartiles by Property Wealth
The fifth page of the dashboard divides school districts into quartiles based on their property wealth.
Figure 5
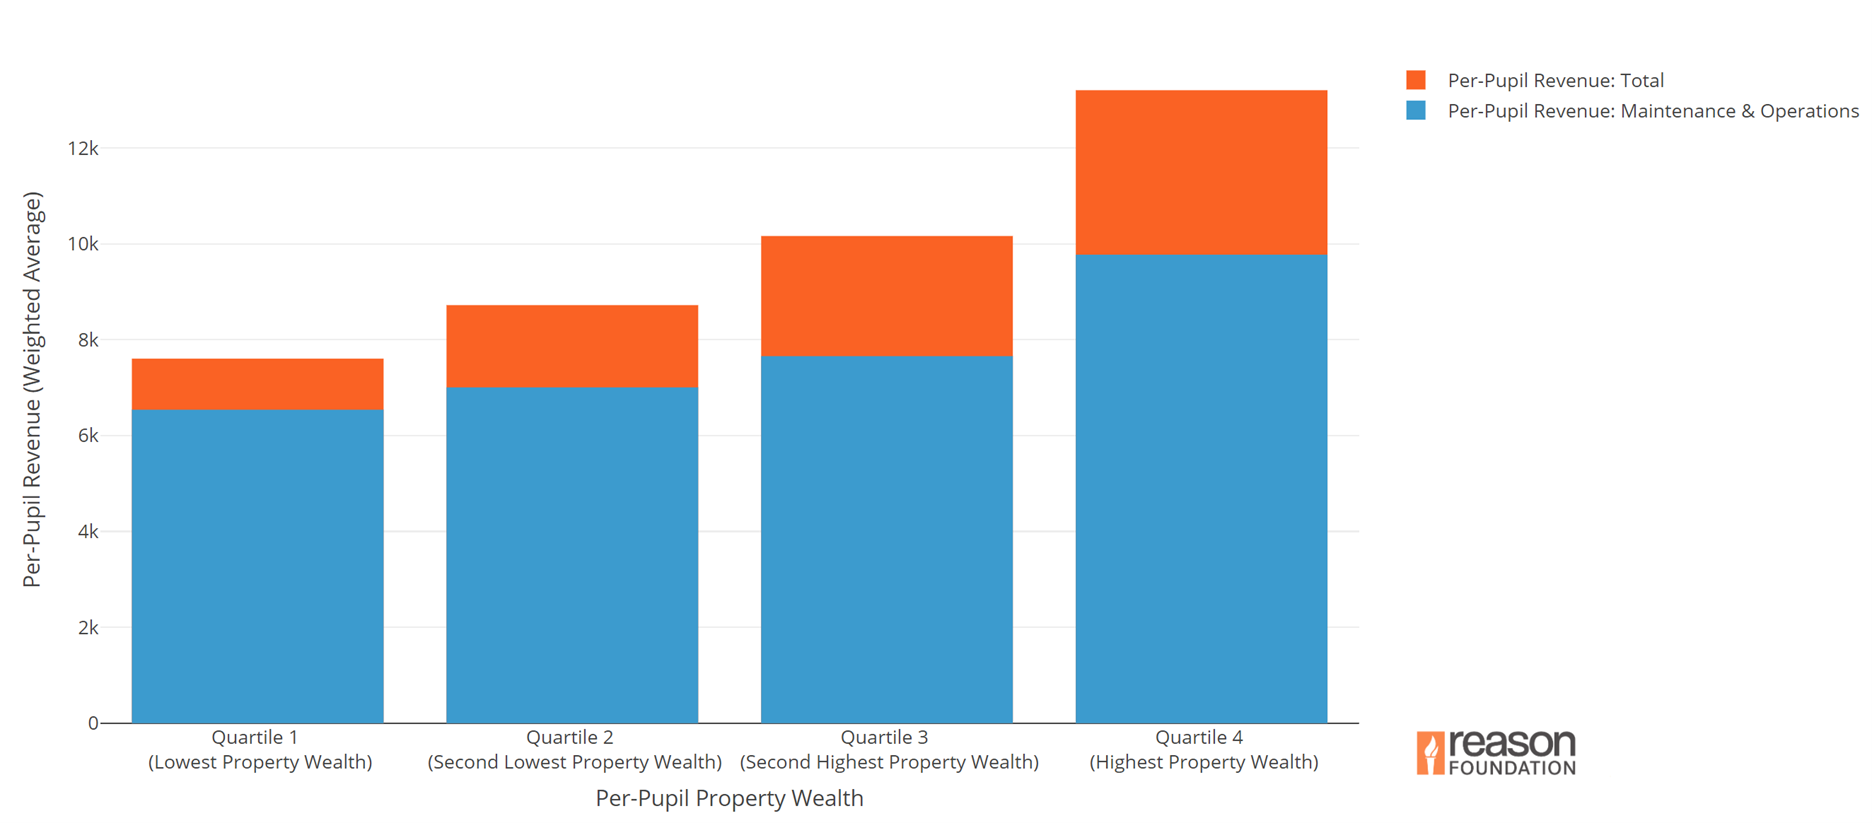
The quartile chart displayed in Figure 5 builds on the basic trends displayed in the previous property wealth and funding section and tab.
Here we can again see the clear relationship between per-pupil property wealth and state and local funding per-pupil. Moreover, this figure displays how the disparities are magnified when all dollars, not just maintenance and operations, are factored into revenue.
Funding Quartiles by Major Revenue Streams
The sixth and final page of the dashboard also breaks school districts into quartiles based on property wealth but provides a more descriptive view of revenue streams.
The revenue source data used on this page was collected from an aggregation of individual FY 2020-2019 district reports instead of the FY 2020-2019 Superintendent Annual Financial Report which we use in each of the above tabs. These district reports provide better insight into the state and local funding streams that make up total per-pupil revenue in Arizona’s schools.
Figure 6
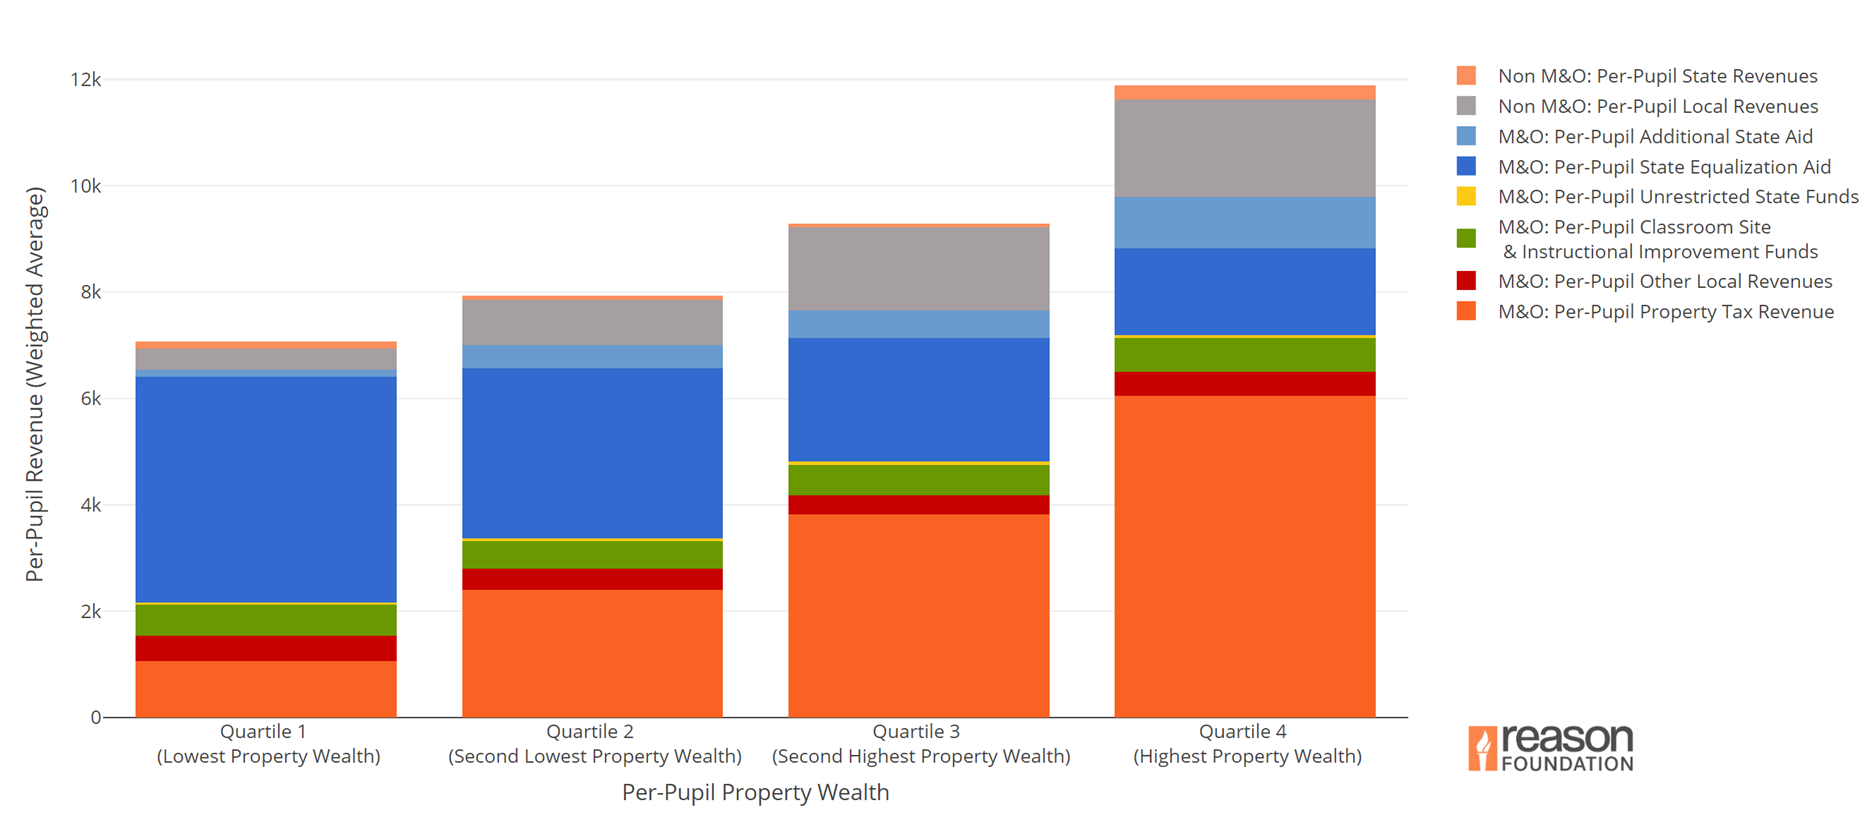
In the above chart, you notice that state equalization aid is distributed progressively while local property tax revenues are distributed regressively (based on district property wealth). This is by design since the state foundation formula guarantees each district a base per-pupil funding level that is funded by some local dollars and the rest supplemented by state equalization aid.
However, when just isolating state equalization aid and local maintenance and operations dollars, Arizona’s wealthier school districts still enjoy higher funding because of the maintenance and operations funds they raise from secondary taxes.
Next, observe that non-maintenance and operations local funds—primarily funds for bonded indebtedness and capital outlays—are a large driver of funding disparities.
Third, additional state aid—funding outside of the state’s foundation formula—also appears to favor wealthier districts. These are state funds meant specifically for property tax relief.
Finally, observe that other revenue sources such as Classroom Site and Instructional Improvement Funds and other local revenues are flatly distributed across school districts of varying property wealth.
Conclusion
The recurring themes in Arizona’s school finance data show how property wealth drives funding inequities and how disadvantaged students often are not getting their fair share of the state’s education resources.
In response to these issues, policymakers need to focus on streamlining Arizona’s many education funding streams so that per-pupil revenue allocations are more transparent and equitable. Policymakers should also consider how inequities in local funding and local tax rates can be addressed. The data show that inequitable local funding is especially relevant when it comes to dollars for school facility improvements—as funding disparities grow when local debt funds are included in the analysis.
The Arizona School Finance Dashboard also highlights the need for stronger data transparency in Arizona. Policymakers can only pursue comprehensive and effective school finance reform when meaningful and accessible data is available to all stakeholders.
Successful school finance reform requires more than merely equalizing per-pupil revenue amounts as Arizona policymakers also need to ensure that local leaders have flexibility in how they can use state dollars and that students with higher needs are being counted and funded properly.
The data presented in the Arizona School Finance Dashboard offers a strong starting point for understanding the challenges that face Arizona students and schools.