

New Hampshire lawmakers are considering legislation that would strengthen the state’s public school open enrollment law. House Bill 741 (HB 741) would establish cross-district open enrollment, allowing students to enroll in public schools statewide, provided school districts have available seats. The following analysis examines the implications of HB 741 for New Hampshire’s students and school district funding.
How open enrollment funding works in other states
Before open enrollment policies, which allow students to transfer to public schools with open seats, are adopted, state lawmakers often ask how the education funding will work. The answer is surprisingly straightforward in most states: just add transfer students to the receiving school district’s enrollment count. When this happens, the district receives the same funding it would for other students, such as those who move from another state or school district. Generally, this means additional state education dollars, while local funding remains unchanged.
Nearly every state that has adopted a strong open enrollment policy, including Arizona, Kansas, Florida, Oklahoma, and Arkansas, has done so without a funding provision.
While the state funding generated by a transfer student is lower than a school district’s average per-student funding, it typically exceeds the marginal cost of serving that student, providing districts with additional revenue. That’s because school district costs don’t increase or decrease in direct proportion to enrollment.
For example, many schools can admit new students without hiring additional teachers, purchasing new curricula, or constructing new facilities. It’s only when enrollment reaches a tipping point—such as when classes are full, or a building runs out of space—that costs spike. That’s why every state open enrollment policy includes consideration for school capacity.
Capacity provisions take many forms but generally allow school districts to set transfer caps based on factors such as class size, grade-level capacity, program capacity, and building capacity. As a result, school districts aren’t required to accept transfer students if doing so would necessitate hiring new teachers, renovating buildings, or taking on other costly line items.
How House Bill 741 deals with funding and capacity
Compared to other states, the open enrollment funding provided by HB 741 would be extraordinarily generous, more than compensating New Hampshire’s school districts for the marginal costs of serving incoming transfer students.
The bill requires students’ resident districts to pay the receiving districts at least 80% of the sending district’s average cost per pupil, as determined by the New Hampshire Department of Education (NHDE). Importantly, school districts would determine capacity for each school and grade level, allowing them to reject transfer applications if demand exceeds available seats. This means school districts wouldn’t be required to hire new teachers or renovate facilities to comply with the law, thereby keeping costs down.
While it’s unclear exactly what funding calculation NHDE would employ, its cost per pupil report, which reports districts’ operating expenditures with some modifications, provides important insight for policymakers. Using this data, which excludes education expenses such as construction, equipment, and transportation, it’s possible to estimate how much funding would follow transfer students across school district boundaries. These estimates are provided in Table 1 below.
Table 1: New Hampshire’s Estimated Transfer Funding Per Student by Sending School District
| New Hampshire School District | Average Cost Per Student | Estimated Transfer Funding Per Student (80% of Average Cost Per Student) |
| Allenstown | $26,020 | $20,816 |
| Alton | $25,233 | $20,186 |
| Amherst | $22,258 | $17,807 |
| Andover | $21,185 | $16,948 |
| Ashland | $28,142 | $22,513 |
| Auburn | $15,135 | $12,108 |
| Barnstead | $18,272 | $14,618 |
| Barrington | $18,787 | $15,030 |
| Bartlett | $32,484 | $25,987 |
| Bath | $34,555 | $27,644 |
| Bedford | $18,498 | $14,798 |
| Berlin | $24,138 | $19,310 |
| Bethlehem | $25,353 | $20,282 |
| Bow | $18,395 | $14,716 |
| Brentwood | $21,591 | $17,273 |
| Brookline | $18,014 | $14,411 |
| Campton | $25,482 | $20,386 |
| Candia | $22,480 | $17,984 |
| Chester | $17,397 | $13,917 |
| Chesterfield | $24,143 | $19,314 |
| Chichester | $23,665 | $18,932 |
| Claremont | $23,288 | $18,630 |
| Colebrook | $23,007 | $18,406 |
| Concord | $23,159 | $18,527 |
| Contoocook Valley | $26,428 | $21,142 |
| Conway | $23,169 | $18,536 |
| Cornish | $30,960 | $24,768 |
| Croydon | $32,103 | $25,682 |
| Deerfield | $22,908 | $18,327 |
| Derry Cooperative | $21,028 | $16,822 |
| Dover | $18,618 | $14,895 |
| Dresden | $25,950 | $20,760 |
| Dunbarton | $18,143 | $14,514 |
| East Kingston | $27,740 | $22,192 |
| Epping | $22,722 | $18,177 |
| Epsom | $24,415 | $19,532 |
| Errol | $30,355 | $24,284 |
| Exeter | $28,218 | $22,575 |
| Exeter Regional Cooperative | $23,934 | $19,147 |
| Fall Mountain Regional | $24,081 | $19,265 |
| Farmington | $22,655 | $18,124 |
| Franklin | $21,464 | $17,171 |
| Freedom | $35,275 | $28,220 |
| Fremont | $20,376 | $16,301 |
| Gilford | $23,377 | $18,702 |
| Gilmanton | $20,745 | $16,596 |
| Goffstown | $17,079 | $13,663 |
| Gorham Randolph Shelburne Coop | $22,360 | $17,888 |
| Gov Wentworth Regional | $24,370 | $19,496 |
| Grantham | $24,396 | $19,517 |
| Greenland | $23,439 | $18,751 |
| Hampstead | $26,754 | $21,403 |
| Hampton | $24,973 | $19,979 |
| Hampton Falls | $33,743 | $26,995 |
| Hanover | $25,447 | $20,358 |
| Harrisville | $33,932 | $27,146 |
| Haverhill Cooperative | $22,463 | $17,971 |
| Henniker | $22,023 | $17,618 |
| Hill | $20,430 | $16,344 |
| Hillsboro-Deering Coop | $24,482 | $19,586 |
| Hinsdale | $25,047 | $20,038 |
| Holderness | $28,890 | $23,112 |
| Hollis | $21,007 | $16,805 |
| Hollis/Brookline Coop | $21,086 | $16,869 |
| Hooksett | $19,285 | $15,428 |
| Hopkinton | $22,424 | $17,939 |
| Hudson | $18,577 | $14,861 |
| Inter-Lakes Cooperative | $31,987 | $25,589 |
| Jackson | $42,514 | $34,011 |
| Jaffrey-Rindge Cooperative | $20,656 | $16,525 |
| John Stark Regional | $21,047 | $16,838 |
| Kearsarge Regional | $25,964 | $20,771 |
| Keene | $19,378 | $15,502 |
| Kensington | $27,354 | $21,883 |
| Laconia | $22,815 | $18,252 |
| Lafayette Regional | $31,757 | $25,405 |
| Landaff | $22,556 | $18,045 |
| Lebanon | $26,624 | $21,299 |
| Lempster | $22,495 | $17,996 |
| Lincoln-Woodstock Coop | $31,584 | $25,267 |
| Lisbon Regional | $26,553 | $21,242 |
| Litchfield | $19,261 | $15,408 |
| Littleton | $27,866 | $22,293 |
| Londonderry | $20,741 | $16,593 |
| Lyme | $28,938 | $23,150 |
| Madison | $33,750 | $27,000 |
| Manchester | $17,734 | $14,187 |
| Marlboro | $24,212 | $19,370 |
| Marlow | $19,626 | $15,701 |
| Mascenic Regional | $19,736 | $15,789 |
| Mascoma Valley Regional | $24,646 | $19,717 |
| Mason | $21,107 | $16,886 |
| Merrimack | $21,512 | $17,209 |
| Merrimack Valley | $19,840 | $15,872 |
| Middleton | $19,773 | $15,819 |
| Milan | $19,366 | $15,493 |
| Milford | $20,765 | $16,612 |
| Milton | $19,483 | $15,586 |
| Monadnock Regional | $21,249 | $16,999 |
| Monroe | $34,131 | $27,305 |
| Mont Vernon | $17,647 | $14,117 |
| Moultonborough | $35,664 | $28,531 |
| Nashua | $18,270 | $14,616 |
| Nelson | $25,032 | $20,026 |
| New Boston | $17,938 | $14,350 |
| New Castle | $44,375 | $35,500 |
| Newfields | $23,890 | $19,112 |
| Newington | $39,328 | $31,463 |
| Newmarket | $23,269 | $18,615 |
| Newport | $27,628 | $22,103 |
| North Hampton | $33,209 | $26,568 |
| Northumberland | $22,601 | $18,081 |
| Northwood | $22,474 | $17,980 |
| Nottingham | $17,992 | $14,394 |
| Oyster River Cooperative | $22,134 | $17,707 |
| Pelham | $18,458 | $14,767 |
| Pembroke | $19,355 | $15,484 |
| Pemi-Baker Cooperative | $21,997 | $17,597 |
| Piermont | $27,296 | $21,837 |
| Pittsburg | $44,484 | $35,587 |
| Pittsfield | $21,649 | $17,319 |
| Plainfield | $28,055 | $22,444 |
| Plymouth | $24,275 | $19,420 |
| Portsmouth | $25,488 | $20,390 |
| Profile | $28,382 | $22,706 |
| Raymond | $21,295 | $17,036 |
| Rochester | $19,582 | $15,666 |
| Rollinsford | $23,622 | $18,897 |
| Rumney | $34,857 | $27,886 |
| Rye | $30,308 | $24,247 |
| Salem | $19,224 | $15,379 |
| Sanborn Regional | $23,756 | $19,005 |
| Seabrook | $27,906 | $22,325 |
| Shaker Regional | $22,025 | $17,620 |
| Somersworth | $21,031 | $16,825 |
| Souhegan Cooperative | $24,900 | $19,920 |
| South Hampton | $29,903 | $23,923 |
| Stark | $21,342 | $17,074 |
| Stewartstown | $35,195 | $28,156 |
| Stoddard | $27,257 | $21,806 |
| Strafford | $19,642 | $15,713 |
| Stratford | $35,397 | $28,318 |
| Stratham | $26,500 | $21,200 |
| Sunapee | $30,750 | $24,600 |
| Tamworth | $34,172 | $27,338 |
| Thornton | $31,349 | $25,079 |
| Timberlane Regional | $20,258 | $16,206 |
| Unity | $27,287 | $21,829 |
| Wakefield | $19,880 | $15,904 |
| Warren | $29,709 | $23,767 |
| Washington | $33,230 | $26,584 |
| Waterville Valley | $36,616 | $29,293 |
| Weare | $18,657 | $14,925 |
| Wentworth | $22,269 | $17,816 |
| Westmoreland | $21,827 | $17,461 |
| White Mountains Regional | $23,385 | $18,708 |
| Wilton-Lyndeboro Cooperative | $21,599 | $17,279 |
| Winchester | $23,651 | $18,921 |
| Windham | $17,560 | $14,048 |
| Winnacunnet Cooperative | $26,312 | $21,050 |
| Winnisquam Regional | $20,975 | $16,780 |
The clear takeaway is that, even without capital funding, substantial sums would follow transfer students to their new school districts under the proposed law. On average, receiving school districts would get $17,200 per transfer student, with statewide amounts ranging from a low of $12,108 per student transferring from Auburn to a high of $35,587 per student transferring from Pittsburg.
For context, Wisconsin’s decades-old, highly successful open enrollment program will provide an estimated $10,102 per transfer student in the 2025-2026 school year and $14,454 per transfer student with disabilities.
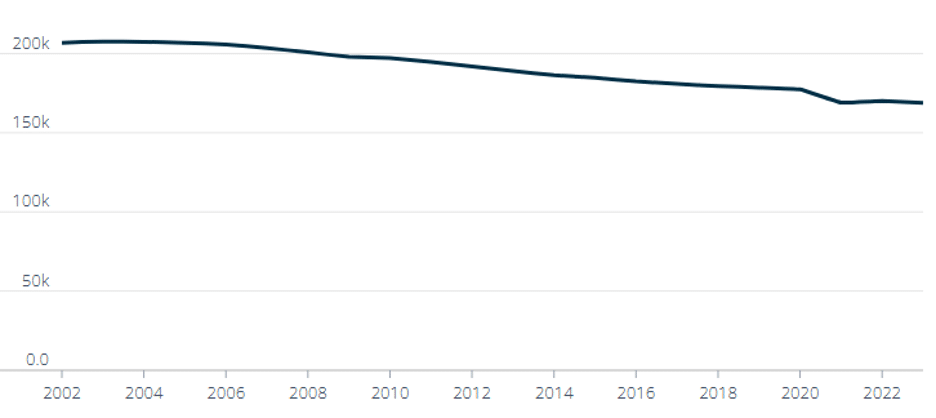
At a time when New Hampshire’s public schools are losing enrollment, which is down nearly 5% statewide since the start of the COVID-19 pandemic, it stands to reason that many school districts will have the capacity to serve incoming transfer students and could benefit from the additional per-student funding.
Chart 1: New Hampshire Public School Enrollment (2002-2023)
Conclusion
New Hampshire policymakers can be confident that HB 741’s bill design would more than compensate public school districts for enrolling transfer students. Because of the proposed policy’s capacity provision, school districts wouldn’t be required to take on substantial new costs to serve transfer students and would likely benefit financially from this policy, especially at a time when enrollment is falling in many school districts.