


The last five years have brought major challenges to the K-12 educational landscape in Virginia—the COVID-19 pandemic, school closures, a rise in chronic absenteeism, and more. Public education has been changing at a rapid pace. And yet, Virginia continues to fund its public schools using its outdated Standards of Quality (SOQ) formula that was developed in the 1970s. This system is non-transparent, inflexible, and unfair. The state can do better by its students, but that requires ripping off the band-aid and pursuing a comprehensive school finance overhaul.
The SOQ is non-transparent and unfair
The SOQ controls 58% of all state and local funds in school division budgets—over $11.5 billion in 2022-2023—and delivers most dollars through opaque student-to-staff ratios and other prescriptive inputs. Virginia’s “resource-based” funding approach is used by a diminishing share of U.S. states, only about one-third at present, and it’s not hard to see why. The SOQ utilizes over 100 different ratios to determine what staff, from classroom teachers to librarians, school divisions need at minimum to educate their students. The formula also has separate calculations for other costs like transportation, school supplies, and utilities. Further compounding the complexity are dozens of state grants funded largely by lottery and incentive funds outside of the SOQ for purposes such as early reading intervention and boosting funding for at-risk students.
Navigating all these funding allocations and demonstrating adherence to their prescriptions, as divisions are required to do, is a lot to ask. It pulls local leaders away from tailoring their budgets to student needs and into a compliance mindset. Worse, putting the focus on staffing inputs also leads to unfair funding patterns.
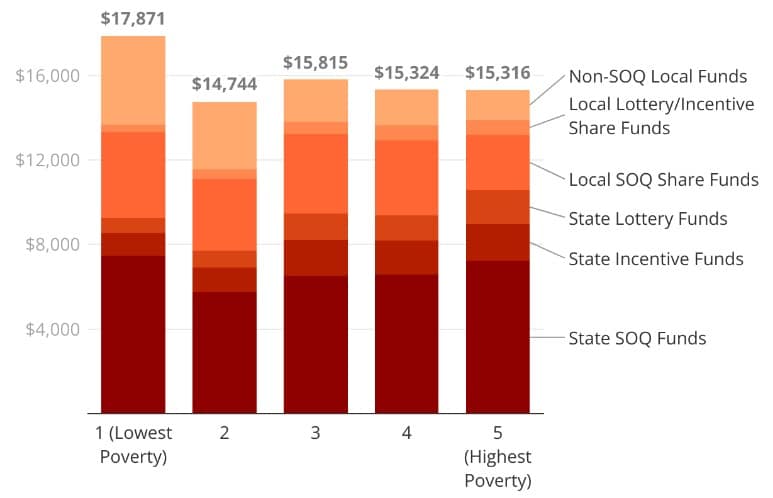
As Figure 1 shows, the lowest-poverty school divisions in Virginia receive the highest funding per student. And because most SOQ staffing ratios and input cost assumptions ignore student needs, funding patterns aren’t closely related to child household poverty rates for divisions outside of the lowest poverty quintile. Instead, the higher-funded divisions in Virginia are those in cities or counties with higher local wealth that can supplement SOQ funds with additional local dollars.
Figure 1: Virginia K-12 State and Local Funding Per Student, by Poverty Quintile (2022-2023 School Year)
Updating the SOQ won’t solve underlying problems
A core problem with the SOQ is its attempts to tailor funding to actual spending practices at school divisions. For example, the formula allocates support staff based on “prevailing practice” at school divisions statewide. Essentially, it recognizes certain types of support staff, looks at how many of those support staff divisions tend to employ for every 1,000 students, and then assumes that’s the number of support positions each division needs. As another example of this prevailing practice approach, the formula funds all SOQ-recognized staffing positions, instructional and non-instructional, based on a complicated statewide average salary calculation (the Linear Weighted Average) of what divisions are actually paying for those positions. As a result, each division is funded based on the same salary structure, which limits their ability to recruit and retain staff tailored to their needs.
However, as documented by a 2023 report published by Virginia’s Joint Legislative Audit & Review Commission (JLARC), the SOQ systematically fails to account for actual spending practices at school divisions. For example, JLARC highlights that the Linear Weighted Average salary calculation underweights higher-spending school divisions with higher-paid staff. Additionally, the formula has had a cap on the number of support staff that the SOQ will fund for more than a decade, which is now substantially lower than what divisions actually spend on those positions. These are just a few of the SOQ issues the report flags for Virginia policymakers to address.
However, trying to capture and adequately fund all the spending practices at school divisions is the wrong-headed approach in the first place. First, it focuses on staffing and other resource inputs, which are one-size-fits-all. State policymakers aren’t well-situated to know how many librarians, gym teachers, or reading specialists a specific school division needs, and they shouldn’t be making budgetary tradeoffs for local leaders. Additionally, trying to bring the SOQ more in line with prevailing practices at school divisions fails to recognize resource scarcity. Virginia’s state education funding grew by 18.6% between the 2020-2021 and 2022-2023 (see Figure 2) school years, adding about $1.45 billion in state funds alone. This new funding outpaced inflation over that period.
Figure 2: Virginia K-12 Funding and Enrollment Growth, 2021-2023

And yet many stakeholders argue that those increases still aren’t enough. But that’s likely because the long-running SOQ fight over how to adequately fund every public school input diverts the attention of policymakers away from specific student populations and instead to flatly raising overall spending levels across divisions. More specifically, reforming the Linear Weighted Average salary calculation or lifting the support staff cap wouldn’t target new funds to higher-need students or lower-wealth school divisions. Instead, those changes would perpetuate the cycle where new funding further locks in division funding and spending patterns, unilaterally drives up prevailing practice costs, and then requires more funding—all while leaving existing unfair funding patterns unaddressed.
To demonstrate this dynamic, Figures 3 and 4 illustrate how recent increases in SOQ funding from FY 2021 to FY 2023 were distributed between divisions of varying local wealth and poverty rates.
Figure 3: Per-Student Distributions of State SOQ Funding Increases by Division Poverty Quintile, 2021-2023
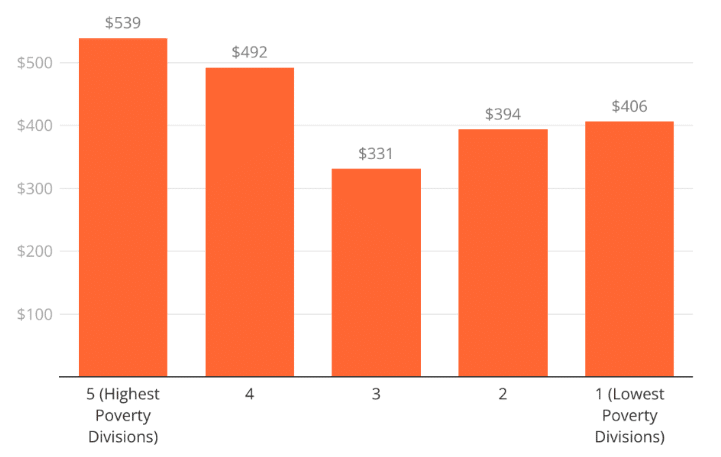
Figure 4: Per-Student Distributions of State SOQ Funding Increases by Division Wealth Quintile, 2021-2023
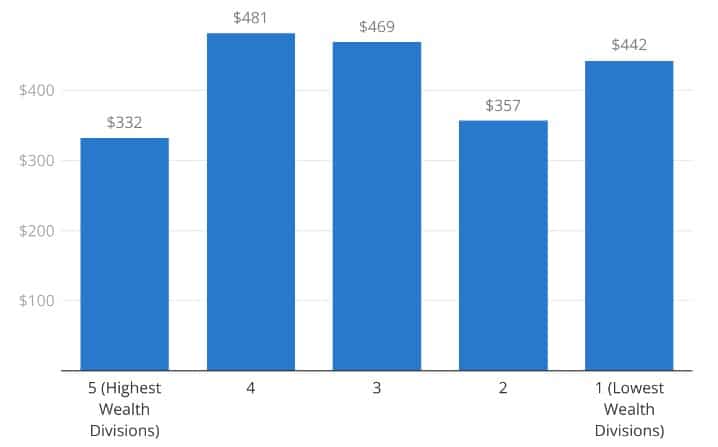
As Figures 3 and 4 illustrate, recent increases in state SOQ funding between 2021 and 2023 have been distributed relatively flatly across school divisions, with little differentiation based on property wealth or poverty. That’s not the most efficient or fair way to use new state education funds.
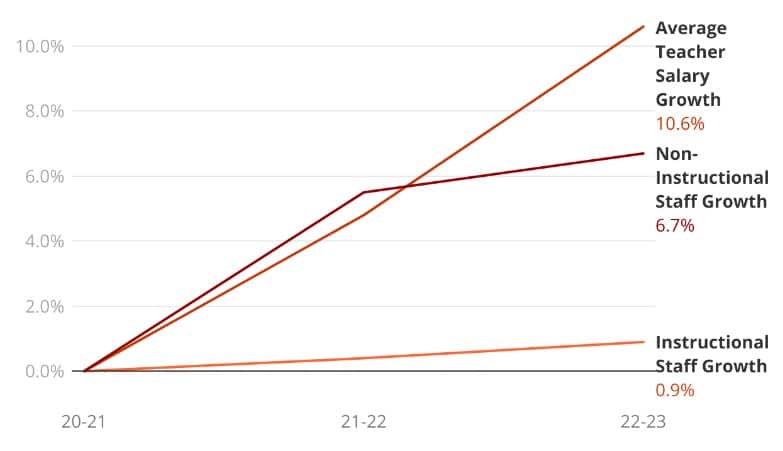
It’s also important to recognize that, despite major shortcomings in the SOQ, Virginia school divisions have continued hiring more support staff and raising teacher salaries (see Figure 5). While JLARC reports that the true prevailing support staff level is about 26 staff for every 1,000 students, divisions actually employ about 49 support staff for every 1,000 students due to positions that aren’t recognized by the SOQ. Nearly all divisions, and those with greater wealth to a larger extent, already leverage billions in local revenues outside of the SOQ to fund these additional expenses.
Figure 5: Growth in Virginia K-12 Staff and Teacher Salaries, 2021-2023
The SOQ does few things well by trying to do far too much. Instead, state leaders should overhaul the existing formula by adopting weighted student funding (WSF), an approach used by the majority of U.S. states and spanning the political spectrum from California to Tennessee.
Adopt weighted student funding
WSF is a simpler and more transparent approach to school finance. States grant each student a base dollar amount and attach additional weights to students with greater needs (e.g., ELL, special education, low-income). Instead of attaching resources to convoluted staffing ratios or other input assumptions, states using WSF place few restrictions on funds and give school districts more flexibility. Importantly, WSF states also often include weights for small and rural school districts that recognize their unique budget challenges.
By attaching resources to individual students, WSF allows state policymakers to efficiently target new funds to different student populations rather than general staffing categories. It also requires local leaders to make their own strategic budgeting and staffing decisions.
While the 2023 JLARC report estimates that converting the SOQ into a weighted formula could cost $1.2 billion, adopting WSF doesn’t need to be that expensive. Ultimately, the final cost depends on the range and magnitude of the weights adopted and the base funding level set, both of which can be based on various cost assumptions. But under WSF, those assumptions aren’t prescriptions, and dollars still have to be allocated in a student-centered manner.
Conclusion
Because of the flawed structure of the SOQ, most recommendations to improve it don’t address its core problems. If policymakers don’t want to preserve the status quo in K-12 education, doubling down on funding divisions’ prevailing practices is the last thing they should pursue. Instead, Virginia should adopt a student-centered funding approach so that any new funds can be targeted more fairly and transparently based on student needs. This puts students, not staff, at the center of K-12 funding conversations and gives local leaders the flexibility to serve their unique student populations.