
Reason Foundation’s new Arizona K-12 Funding Reform Model allows users to model how changes to components of the state’s school finance system would impact education funding. Most features of the state’s school finance formula—like the base dollar amount per student, the weight for English learners, and weights for special education students—can be altered using the model. The tool will summarize the funding impact of these changes for each school district and charter school in the state and users can turn off or turn on the various local sources of revenue for school districts. Note that this model does not include federal funds or state categorical grant funds, and it is based on complete funding data published by the Arizona Department of Education for the 2020-2021 school year.
You can explore the interactive model here: Arizona K-12 Funding Model
Another unique feature of the Arizona K-12 Funding Reform Model is that it allows users to consider cases where school districts may want to opt-in to different funding formulas. While this isn’t an option for school districts under current law, it’s a policy that’s been proposed by recent legislation. Specifically, users can consider how any changes to the model might incentivize school districts to opt-in to receive funding from the state’s charter school funding formula or to opt for a per-pupil transportation funding amount rather than receive transportation funding based on school bus route miles.
The model’s features are intended to give policymakers and researchers insights into how Arizona’s flawed school finance system can be streamlined and strengthened. While K-12 finance reform is a big political lift, the tool empowers users who have some familiarity with the state’s funding system to explore how reform options could impact school districts and charters across the state.
The model includes several pre-loaded scenarios that will be explored below. Users should note that none of the three scenarios are being endorsed by Reason Foundation and they are only being used to understand the model’s capabilities and to explore potential reforms.
Scenario 1: Some Changes Proposed in SB 1269 of 2022
The first pre-loaded scenario in the model tool mirrors some of the changes included in a bill proposed in the Arizona legislature during the 2022 session, SB 1269. This scenario simulates the following changes to the state’s funding system:
- Increases the Base Level Amount per student to $4,413.37 (2.5% increase, based on the 2020-2021 base per student amount)
- Eliminates the Teacher Experience Index (TEI)
- Eliminates the Additional Teacher Compensation
- Eliminates the Transportation Revenue Control Limit (TRCL)
- Proposes per pupil transportation amount to $347 (for districts that want to opt-in to a flat, per student transportation funding amount)
- Adds a middle school weight of 0.198 (this change wasn’t in SB 1269)
Scenario 1 eliminates some unfair aspects of the state’s funding system, such as the teacher experience index (TEI), which directs greater funding to half of the state’s districts with more experienced teachers. Notably, it also repeals the transportation revenue control limit (TRCL), a funding source that allows districts to raise local transportation funds based on outdated student enrollment counts without voter approval. To counterbalance these cuts, Scenario 1 also increases the 2020-2021 base funding amount per student by 2.5 percent.
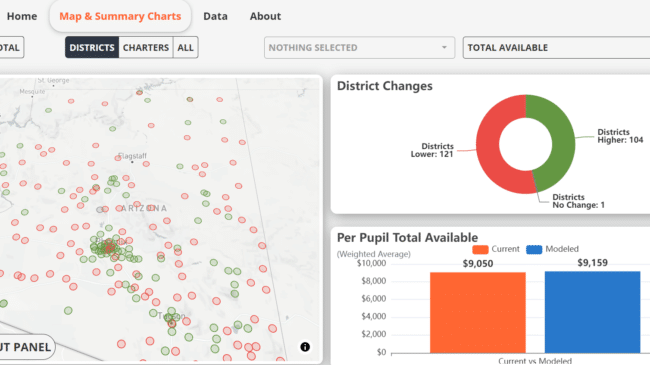
The model’s map and summary charts provide helpful data that estimates how these changes could affect Arizona school districts. Under Scenario 1, 121 school districts would see a reduction in overall funding, 104 would see an increase, and one district would see no change. Statewide, the average per pupil funding for Arizona district students would increase from $9,050 to $9,159 per student, and the amount of state equalization assistance required from the state budget for both districts and charters would increase from $4.992 billion to $5.244 billion (a $252 million increase).
Users can also look at the Transportation Comparison under the Modeled Output selection, which shows how many districts would have an incentive to opt into Scenario 1’s flat $347 per pupil transportation funding amount rather than receiving funding as they currently do under a transportation route mileage-based funding formula. This view shows that 70 districts would receive more transportation funding under the flat per-pupil allocation. These districts that opt for a flat per pupil transportation allocation would also have the added benefit of additional spending flexibility.
Scenario 1 simulates several important and much needed changes to the state’s K-12 finance formula. All eliminated funding factors such as the TEI and additional teacher compensation measures distort student funding fairness. But the most impactful component of Scenario 1 is the elimination of the TRCL. Statewide, districts receive about $80 million in additional funding from TRCL and it is a major revenue source for many of Arizona’s small school districts. For instance, users can hover over the southern region of the state with their cursor and see that some of the small districts in this region would lose substantial funding from the elimination of TRCL (e.g., Sonoita Elementary District). While this does not mean that eliminating TRCL isn’t possible or necessary, it is a reality that policymakers will have to consider when reforming Arizona’s funding system.
Scenario 2: Cleaning Up the Formula and Boosting the High-Incidence, Low-Need Special Education Weight
Scenario 2 simulates four changes included in Scenario 1. These are:
- Increases the Base Level Amount per student to $4,413.37 (2.5% increase, based on that year’s base amount)
- Eliminates the TEI
- Eliminates Additional Teacher Compensation
- Increases the weight for “DD, ED, MIID, SLD, SLI, and OH” to 0.1 (this is AZ’s mild disability weight and the largest student disability group by far)
Like Scenario 1, Scenario 2 also eliminates unfair features of Arizona’s funding formula and again increases the base funding amount per student by 2.5 percent. Scenario 2 also proposes an increase to the mild disability weight from .003 to 0.1, or from $13.24 to $441.34 for each student in this category. This attaches additional funds to students with a developmental delay, emotional disability, mild intellectual disability, specific learning disability, speech/language impairment, or other health impairment. Students in these groups comprise a large majority of Arizona’s special education population and most of them spend the biggest portion of their time in general education classrooms.
The map and summary charts estimate how Scenario 2 would impact every district and charter in the state. Under this scenario, 138 school districts would have higher funding, 59 would have lower funding, and 29 would see no change compared to current levels. Statewide, the average funding for traditional district students would increase from $9,050 to $9,105 per student, and the amount of state equalization assistance required for districts and charters would increase from $4.992 billion to $5.078 billion, an $86 million increase.
Scenario 2, like Scenario 1, would eliminate some of the most glaringly unfair features of Arizona’s funding system and counterbalance those cuts with both an increase to the base funding amount and a substantial boost to the mild disability special education weight. Interestingly, Scenario 2 wouldn’t be nearly as costly to the state budget as Scenario 1 because rather than adding a weight for all middle school students as the first scenario does, it would include a targeted funding increase for special education students.
Scenario 3: Merging Funding Formulas for Charters and Districts
The model’s District-to-Charter Formula view allows users to analyze how many school districts would be incentivized to opt into the charter school funding formula when considering changes made in the model. Interestingly, this view shows that even when no changes are made to the current funding system, 75 Arizona school districts would already have an incentive to opt into the charter formula. Although this isn’t an option under current state law, it was a proposed change in SB 1269 in 2022.
This is because the charter formula provides additional state funding primarily for facilities (known as Charter Additional Assistance, CAA) while traditional districts rely on voter-approved bond levies and other levies for school operations to raise additional funds beyond what the formula provides. While many traditional districts can raise more locally than what charters receive from CAA, these 75 districts either raise less from their local levies per student than the charter CAA amount or they can’t pass any local levies at all.
Scenario 3 gives users a good opportunity to further explore this charter formula opt-in feature under the following changes to the District-to-Charter Formula tab in the Model Input Panel:
- Increases CAA (Pre-schoolers with disabilities, grades K-8) from $1,875.21 to $2,200 per student
- Increases CAA (grades 9-12) from $2,185.53 to $2,500 per student
If users look at the District-to-Charter Formula map, they can see that these parameter changes in Scenario 3 increase the number of districts that would be more highly funded under the charter formula from 75 up to 96—about 42 percent of the state’s school districts. This insight highlights how further increases to CAA could both close the average funding gap between districts and charters and make the reliable funding streams from the charter formula a more appealing option for a large share of Arizona’s traditional school districts who can’t easily raise funds from local levies.
While the model summary charts themselves don’t allow users to estimate the cost to the state budget of 96 districts opting into the charter formula, users can download the modeled data directly and quickly generate an estimate of this cost. If all 96 school districts that would be better off under the charter formula opted in, it would cost the state an estimated $188.7 million. Additionally, because the CAA amount would also increase for each charter student, users can pull from state-reported charter enrollment data to estimate that there would be an additional state cost of $74.8 million for the funding increase to charters.
Conclusion
The three scenarios explained above are only a sampling of the Arizona K-12 Funding Reform Model’s capabilities. None of these scenarios should be interpreted as explicit policy recommendations, but they illustrate how this new tool provides users with transparent data and allows them to test the viability of potential reforms to Arizona’s school finance system.