

In the wake of the COVID-19 pandemic, public education is grappling with an unprecedented set of challenges, such as student learning loss, declining enrollment, and teacher strikes.
Reason Foundation’s latest study, Public Education at a Crossroads, brings together key revenue, expenditure, enrollment, staffing, and student performance data for the past two decades so that policymakers in all 50 states are better equipped to make decisions that will impact generations to come.
The timeframe considered in this study—2002 to 2020—was selected based on the availability of state-level school finance summary data from the U.S. Census Bureau at the time of writing. To be sure, much has changed since 2020 when the COVID-19 pandemic swept the nation, but pre-pandemic education trends provide policymakers with a critical anchor for navigating post-pandemic decisions.
The study identifies five key national trends.
1. Education funding is up in nearly every state.
Even before the COVID-19 pandemic, public education funding was at record levels. In 2020, the U.S. spent $16,065 per student, with nine states surpassing $20,000 per student, including New York at $30,723 per student.
Between 2002 and 2020, 49 of 50 states saw real increases in revenue per student, with funding growth exceeding 50% in five states—New York, New Hampshire, Illinois, North Dakota, and Washington.
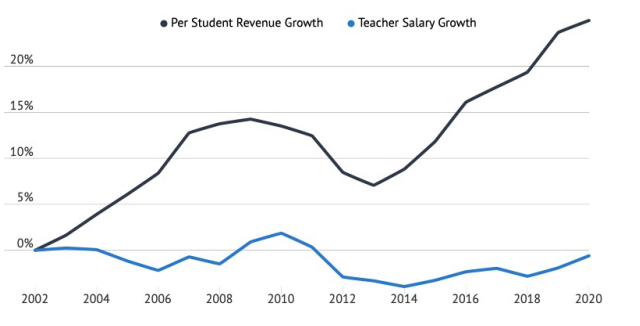
2. Teacher salary growth lagged behind education funding growth in all 50 states.
Importantly, increases in education funding in many states have not translated into higher teacher salaries. Nationwide, total inflation-adjusted education spending increased by 25% per student while average teacher salaries fell by 0.6% from 2002 to 2020.
A notable example: Illinois’ inflation-adjusted per student revenue increased by $7,141 from 2002 to 2020, while its real average teacher salary fell by $3,301 during that time. Similar trends for spending and teacher salaries were observed in Pennsylvania, Delaware, and other states.
Figure 1: U.S. Revenue Per Student Growth vs. Average Teacher Salary Growth (2002-2020, Inflation Adjusted)
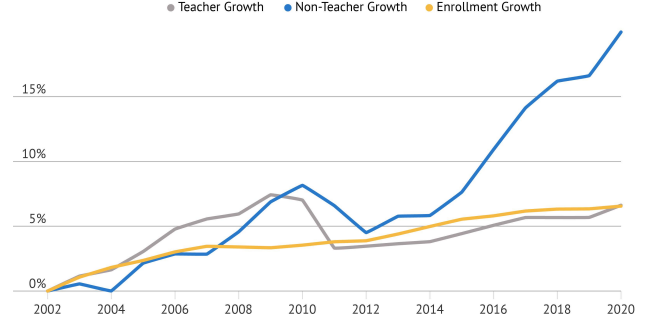
3. Public school staffing growth is far outpacing student enrollment growth.
A prevailing trend across states is to add new staff, regardless of public school enrollment levels. Between 2002 and 2020, nationwide U.S. public school enrollment increased by 6.6% while total staff grew by 13.2%.
At the state level, staffing growth exceeded student growth in 39 of 50 states. Much of this can be attributed to growth in non-teaching staff, which increased by an average of 20% across all states.
Even in states with declining student populations—such as New York, Illinois, and New Hampshire—public school staffing is still increasing. For instance, Connecticut’s total staff grew by 14.1% while its student enrollment declined by 8.2%.
Figure 2: Public School Staffing vs. Student Enrollment Growth (2002-2020)
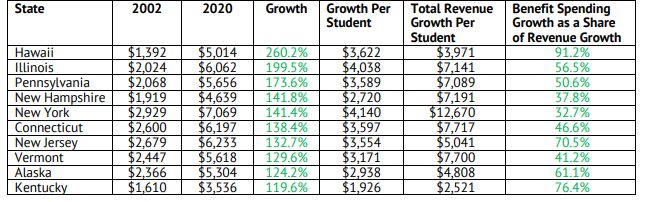
4. Education dollars are increasingly going toward spending on employee benefits.
Education funding is increasingly devoted to paying for employee benefits, including pensions, health insurance, and Social Security. Nationwide, real spending on education employee benefits increased by $1,499 per student, or 78.6%, from 2002 to 2020. In many states, benefit spending growth ate up over half of their education revenue increases.
For example, nearly all of Hawaii’s per-student funding growth went to this expenditure category alone, with similar trends observed in New Jersey, Alaska, and other states.
Table 1 compares funding growth and benefit spending growth for the top 10 states in benefit spending per student.
Table 1: Benefit Spending Per Student Growth vs. Total Revenue Per Student Growth
5:. There isn’t a consistent relationship between education funding growth and student outcomes across states.
Statewide investments in public education don’t automatically lead to increased student achievement on standardized tests. Notably, New York had a substantial increase in per-student funding between 2002 and 2020—ranking first in the nation at 70.2% growth. However, despite the increased spending, New York’s National Assessment of Educational Progress (NAEP) scores were largely flat during that period, including declines in both 4th and 8th grade reading scores.
In comparison, states such as Florida and Arizona had modest education funding growth, ranking 43rd and 47th, respectively, in spending growth, but saw significant improvements in their NAEP scores (especially for their low-income students).
There are many factors that might contribute to these trends—and test scores don’t capture everything that’s important in education—but there’s an undeniable disconnect between spending growth and test scores across states, even when just comparing low-income students.
Conclusion
These education trends and the other data and highlights in our study provide policymakers with a critical anchor for navigating post-pandemic public education decisions. While the five key national trends are an important starting point, stakeholders should evaluate the detailed data for their own states. The full study can be accessed here, and our 50-state appendices with detailed information on each state can be accessed here.