

Horizontal and vertical equity are key objectives of school finance policy. While horizontal equity means ensuring that students with similar needs attract similar levels of funding no matter where they live or attend school, vertical equity means allocating different levels of resources to students based on their unique needs. The latter is meant to ensure that the unique disadvantages facing students afflicted by poverty, disabilities, low English proficiency, and other such factors, are mitigated.
In the case of poverty, the disadvantages are manifold. Economically disadvantaged students lag behind their wealthier peers in academic results and student achievement and generally possess lower levels of social, financial and health capital. They’re also more likely to be exposed to negative stressors, like crime and pollution, which can undermine their cognitive and emotional development, and are more likely to attend lower-performing or less-resourced schools in socio-economically disadvantaged areas. Many attend school in districts with lower levels of local property wealth, which are less capable of raising funds for schooling without state aid.
Recognizing these issues, government committees and school finance researchers alike generally support the allocation of additional funds to school districts and schools based on student poverty levels. The federal government, as well as 41 state governments across the country, provide additional funding based on the presence of economically disadvantaged students in a school district.
While 18 states allocate additional funds based solely on the raw numbers of economically disadvantaged students in a school district, nine states instead allocate funding to school districts based on the ‘concentration’ of economically disadvantaged students in a district, and 14 use a combination of the two approaches.
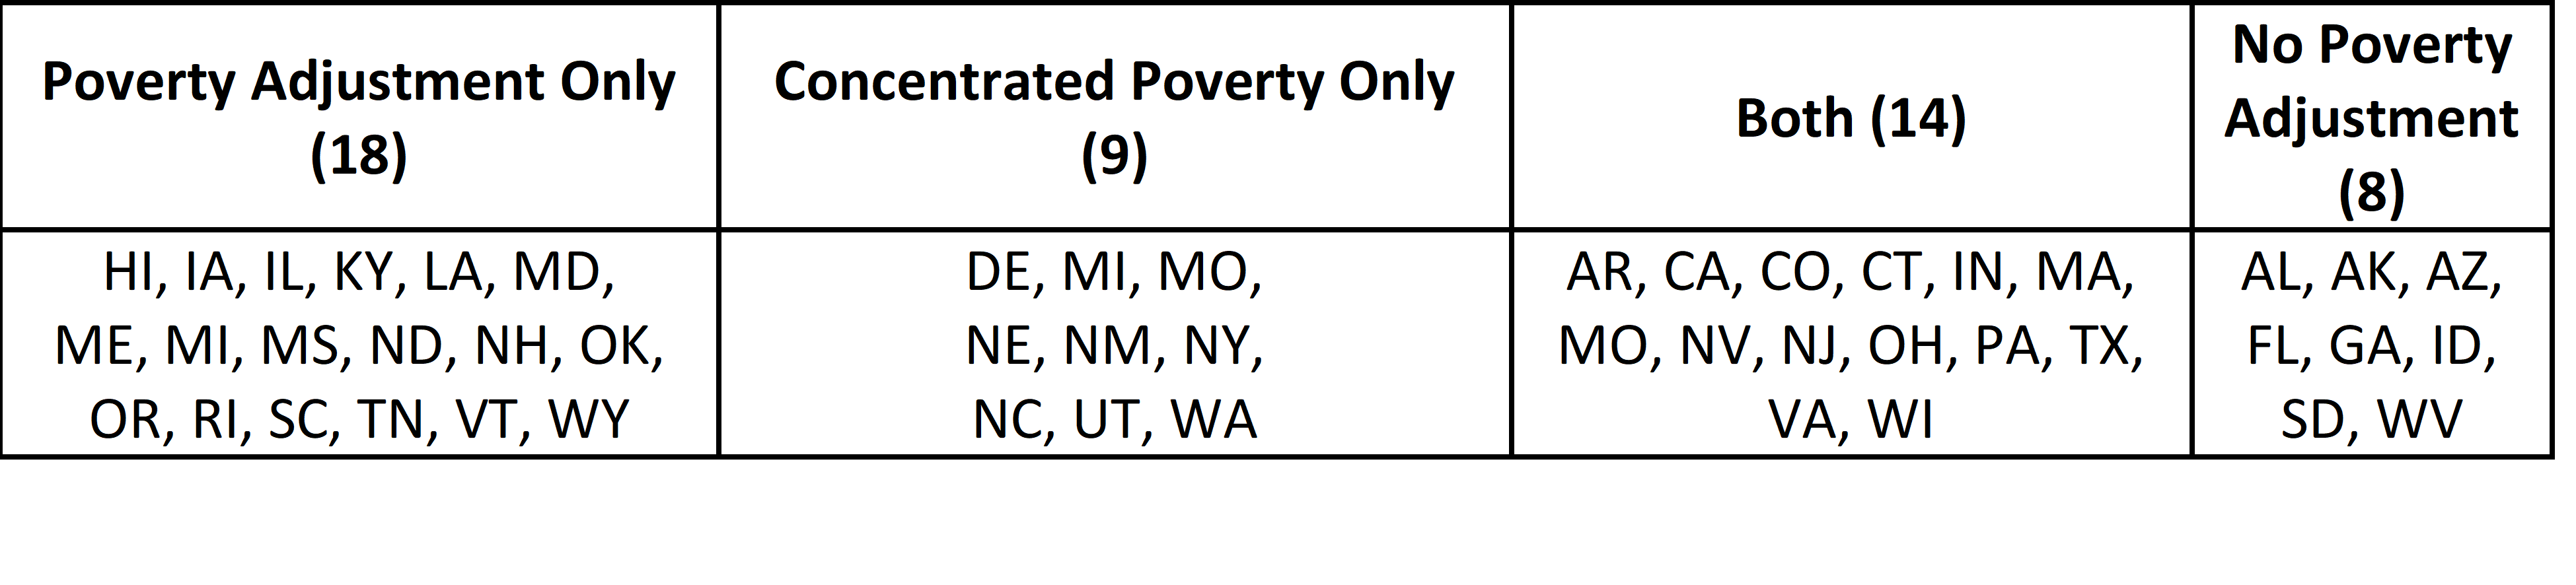
Note: Analysis and table does not include Kansas (KS)
The following discussion will consider the different approaches that these states take towards funding for concentrated poverty. It will also analyze the rationale behind funding based on poverty concentration and will examine its pros and cons as well as the implications for equity.
Differing Approaches to Funding For Poverty Concentration
The most common approach to funding for poverty concentration is to allocate supplemental funding — or to apply a multiplier or weighting to the base per-student funding amount, for every student afflicted by poverty. This multiplier, weighting or amount varies dynamically depending on the concentration of student poverty within the school district. In other words, a state that takes such an approach may fund every low-income student in a district where 30 percent of the students are low-income at a lesser rate than every low-income student in a district where 50 percent of the students hail from low-income backgrounds. The states that take this approach include Arkansas, Ohio, Texas, New York, New Jersey, Virginia, Massachusetts, Pennsylvania, Connecticut and California.
By contrast, Missouri and Nebraska do not apply any multiplier or weighting for students afflicted by poverty unless the school district they belong to has a student poverty concentration which is above a certain threshold. In Nebraska’s case, the funding multiplier is applied only to economically disadvantaged students above the threshold, whereas in Missouri’s case, all economically disadvantaged students attract the funding multiplier provided that their district itself has a poverty concentration that lies above the stipulated threshold.
Other states like North Carolina also apply varying multipliers for poverty concentration but use alternative measures instead of childhood poverty estimates (such as average district household income in the case of NC). Another example is Pennsylvania, which provides supplemental funding to districts with lower-than-state-average median household incomes. The state also uses a funding multiplier that varies for every economically disadvantaged student in each district depending on the district’s poverty concentration.
One issue with awarding a higher funding multiplier for all poor students (not just those above a threshold) in concentrated poverty districts is that it risks granting school districts radically higher or lower amounts of funding between years should they sink just below or rise just above a particular concentration threshold. This is why states like Arkansas stagger these significant funding changes over a multi-year period to allow districts to adjust.
Still other states take unique approaches to funding for concentrated poverty. Indiana, for example, provides a grant to school districts by first multiplying a supplemental dollar amount by the percentage of economically disadvantaged students in a district and then multiplying the result by the district’s total student count. This could be intended to award higher funding to districts which service a larger number of students. Minnesota uses a formula that provides increased funding based on poverty concentration yet limits the amount of supplemental funding that districts with very high poverty concentrations can receive. In Wisconsin, a state that has a separate allocation for individual students afflicted by poverty, funding is also provided to districts with poverty concentrations above a specified threshold. This funding stream does not contribute to a district’s overall funds, and only counts towards reducing the local contribution towards their own education costs that they’re required to raise.
Some states address concentrated poverty through program-specific grants. Nevada, for instance, provides program-specific funding grants to schools that are designated as “victory schools,” i.e. those that are both low-performing and possess a certain minimum poverty concentration. West Virginia, Utah and Washington also provide program-specific funding that varies based on a school district’s poverty concentration or average poverty levels. An issue with this kind of scheme is that the program-specific nature of the grant limits the flexibility of school and district leaders to tailor spending to local needs and holds them less accountable for improving student outcomes as they’re bound by the state mandate that allocates resources towards specific programs.
Pros and Cons of Concentrated Poverty Funding
The practice of funding based on a school district’s poverty concentration is based on longstanding research finding that higher poverty concentration in a school is correlated with lower school-wide achievement that goes beyond the effect of poverty on individual students. In other words, high poverty concentration within a school or school district is correlated with poorer outcomes on average for all students in that school or school district. Another important consideration is that high poverty-concentration schools are more likely to struggle to attract and retain teaching talent if they can’t provide additional compensation.
One potentially negative effect of providing supplemental funding to schools on the basis of poverty concentration is that it doesn’t fund all students in a certain need category at the same level. With concentration funding, low-income students attending schools with lower poverty concentrations are arguably ‘short-changed.’ Additionally, due to the zero-sum nature of school finance, providing poverty concentration funding implicitly means less funding per-pupil for all poor students who are not attending such high poverty concentration school districts. State policymakers must weigh the pros of providing supplemental funding for poverty concentration against the downside of being left with less per-pupil funding for low-income students in other districts, as well as for students across all incomes attending school in other school districts.
Missouri is a notable example of where funding solely for concentrated poverty at the expense of individual student poverty can produce detrimental results. While the funding ratio for low-income vs non-low-income students across the United States remained as progressive on average as it was in 1995 even by 2014, and more states increased funding progressivity during this timeframe rather than the opposite, the state of Missouri was an outlier. Its funding ratio became significantly less progressive by 12 percentage points. This is partially because of Missouri’s adoption of a school district funding formula in 2006 which provides supplemental poverty funding only to districts with higher than average low-income enrollment levels, thereby failing to fund disadvantaged students in less-disadvantaged districts. It should be noted, however, that other factors in Missouri’s funding formula, including its failure to adequately equalize funding between districts for disparities in local property wealth and its “hold harmless” provision that allows some districts to lock in higher levels of funding from previous years that they may otherwise no longer be entitled to (at the expense of other districts), have played a substantial role in this issue too.
Implications for Open Enrollment Policies
Concentrated poverty funding also has implications for a state’s open enrollment (i.e. inter-district enrollment) policy. For example, a low-income student may be attending a school district with lesser poverty concentration but live in an area with a higher poverty concentration. Despite the lower poverty concentration of the school they attend, this student might still require a greater intensity of services (for example, this could be because of issues like family violence, crime or drug abuse, that tend to be more prevalent in high poverty concentration communities). This could disincentivize school districts from accepting outside students from high poverty concentration districts due to a lack of funds to service their needs.
A similar consideration is that attaching funding to school districts based on their poverty concentration means that schools lose a less significant amount of revenue if one of their students enrolls outside their district and may then have a reduced incentive to improve the quality of their education in order to retain students. However, the opposite could be the case if leaving students pushed their former school district into a lower poverty concentration threshold.
Evidence of this incentive structure can be seen in California where a transition to a weighted-student funding model, combined with liberalized open enrolment policies, was followed by an improvement in even those public school districts which lost students to other districts. This is because these schools became more responsive to student concerns and improved the quality of their offerings after closer consultation with their communities in order to stymie the outflow of students.
Conclusion
While no particular approach can be definitely deemed to be the right or perfect one, it’s nonetheless advisable to implement higher funding multipliers to students above specified concentrated poverty thresholds rather than a higher multiplier to every economically disadvantaged student in a district based on the concentrated poverty threshold that the district falls within.
For instance, in a state that applies a higher funding multiplier for students in a school that has a poverty concentration over 50 percent than one with a concentration under 50 percent, 50 percent of students at the school will attract funding based on the lower multiplier, and economically disadvantaged students in excess of 50 percent will attract the higher multiplier. This would be instead of the higher multiplier being applied to every economically disadvantaged student. This is akin to the progressive threshold system upon which income taxes are based, and would mitigate drastic funding differences between districts that fall into different concentrated poverty brackets. It also negates the need to ’stagger’ funding changes over many years for districts that experience enough of a decline or increase in low-income students between years to put them in a different poverty concentration bracket (as is the case in Arkansas) since they would not drastically lose or gain funding between years.
The decision to allocate funding based on a school district’s poverty concentration instead of, or in addition to, funding individual economically disadvantaged students must be weighed against the trade-offs highlighted above.