

There are 41 states that allocate additional resources to school districts for economically disadvantaged students to account for the unique challenges and difficulties they face. Across the board, states have struggled with correctly identifying, or at least estimating, the prevalence of student poverty within a school.
While eligibility for the federal government’s National School Lunch (NSL) program remains the most widely-used measure, it suffers from a number of issues that reduce its effectiveness in identifying the concentration of poverty.
States are thus increasingly moving towards alternative metrics or using NSL-eligibility in tandem with other criteria to more effectively allocate poverty funding. This commentary examines those approaches, their unique merits and caveats, and their implications for equitable public education funding.
Eligibility Criteria by State
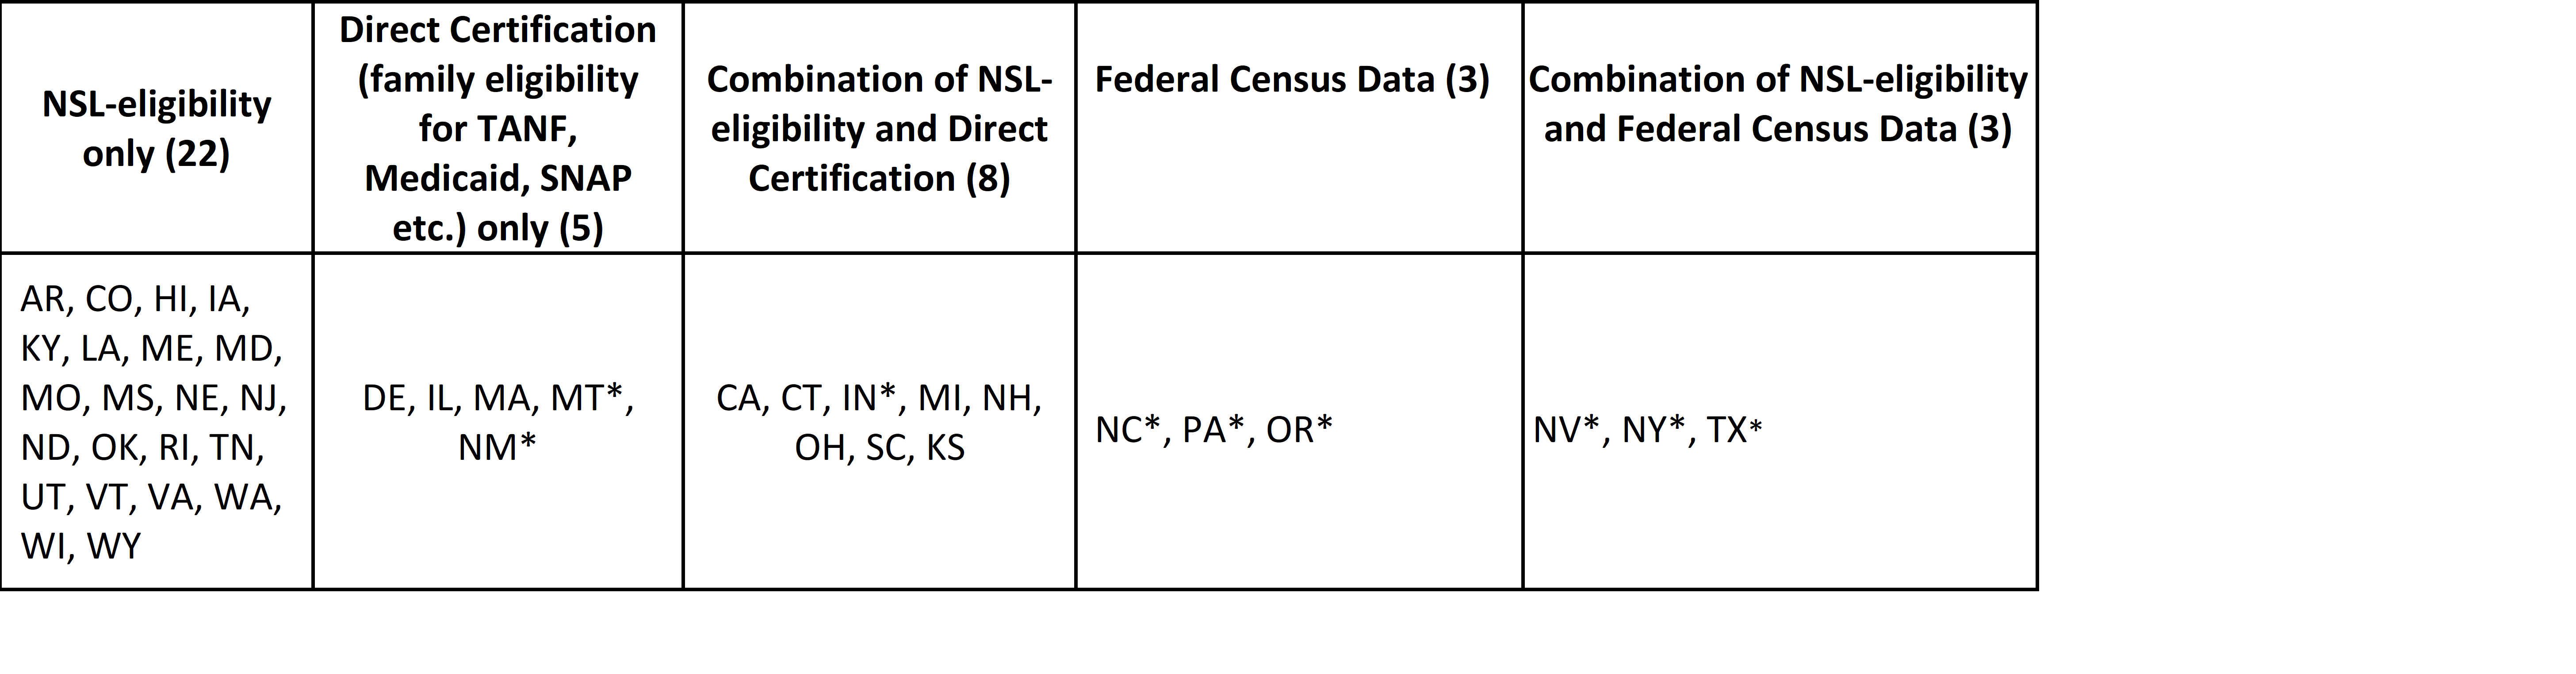
*Sources and further information on each state can be found at the bottom of this page.
Alternative Measurements
The most commonly used alternative to NSL-eligibility as a measure for identifying students in poverty is to directly certify students as economically disadvantaged based on their family’s eligibility for other means-tested public assistance programs including the Supplemental Nutrition Assistance Program (SNAP), Temporary Assistance for Needy Families (TANF) and state Medicaid pilots.
Other measures used by states to identify student poverty include federal census data, average per-capita income, average property value in the school district, eligibility for federal Title-I funding, homelessness, and/or belonging to a foster home or a migrant family.
Metrics for Identifying Student Poverty By State
| NSL | SNAP | TANF | Medi-caid | Childrens Health Insurance Program | FDPIR | Free Milk Program | Title- I | Federal Census Data | Home-lessness | Foster Home | Migrant Family | Low Wealth County | |
|---|---|---|---|---|---|---|---|---|---|---|---|---|---|
| California | X | X | X | X | X | ||||||||
| Connecticut | X | X | X | X | X | ||||||||
| Delaware | X | X | |||||||||||
| Illinois | X | X | X | X | |||||||||
| Indiana | X | X | X | X | |||||||||
| Kansas | X | X | X | X | X | ||||||||
| Massachusetts* | X | X | X | X | |||||||||
| Michigan | X | X | X | X | X | X | X | ||||||
| Montana | X | ||||||||||||
| Nevada | X | X | |||||||||||
| New Hampshire | X | X | X | ||||||||||
| New Mexico | X | ||||||||||||
| New York | X | X | |||||||||||
| North Carolina | X | X | |||||||||||
| Ohio | X | X | X | ||||||||||
| Oregon | X | X | X | ||||||||||
| Pennsylvania | X | ||||||||||||
| South Carolina | X | X | X | X | X | X | X | ||||||
| Texas | X | X | |||||||||||
*- Massachusetts additionally allows schools or school districts to certify students who participate in Head Start/Early Head Start, are on a list of homeless children identified by the district homeless liaison, are migrants, or are runaway children, for the purpose of meeting the 40 percent eligibility threshold for the federal government’s Community Eligibility Provision (CEP). However, these students do not attract additional poverty funding from the state, though an estimated 80 percent+ of homeless students in the state are typically captured by directly certifying for SNAP, TANF, foster care, and the state Medicaid pilot (MassHealth) — based on data obtained from “Measuring Student Poverty: Dishing Up Alternatives to Free and Reduced-Price Lunch.” Excludes states that rely solely on NSL-eligibility.
The Pros and Cons of Direct Certification
Directly certifying students as economically disadvantaged based on their family’s eligibility for means-tested public assistance programs outside of the National School Lunch program offers a number of benefits.
First, it forgoes the need for districts to expend resources by ensuring that students fill out and submit application forms for NSL.
Second, it eliminates the problem of schools signing up for initiatives like the federal government’s Community Eligibility Program (CEP) that allows schools to automatically certify all their students as NSL-eligible provided that certain conditions are met. Doing so would result in the over-allocation of scarce resources to schools where this allocation does not reflect the actual prevalence of poverty.
Third, most of these programs have a significantly lower eligibility threshold with regards to household income than the National School Lunch program. The NSL renders students whose family’s income is less than 185 percent of the federal poverty line as eligible for free or reduced-price lunches. While a lower income eligibility threshold would cause fewer students to attract funding, it would also allow the state to allocate a greater amount of funding for each student who is classified as disadvantaged, thereby promoting fairness and equity through more calibrated identification and targeting of greater degrees of poverty.
Despite these benefits, the direct certification also poses several challenges. For one, the burden of applying for the programs in question falls upon families instead of schools and this can cause an undercount of low-income students. For example, SNAP applications look different in each state. Some states require official documentation of birth, residence, income and some even require an interview.
By contrast, NSL applications usually come in registration packets or are otherwise made widely available. They are submitted directly to school staff, who often support their completion, and rely on self-reported statements of income instead of official documentation. Direct certification, then, could adversely affect students whose families have low literacy levels or English proficiency, transportation challenges, inflexible work schedules, are unable to document income, or are children of immigrant U.S. citizens or non-citizens.
Attempting to match school enrollment databases to public benefit databases could also result in the undercounting of low-income students. Schools may face difficulties, like the existence of students with varied name spellings. Granting schools and districts access to government databases for public assistance programs in order to certify students may also raise privacy concerns.
Case Study: Massachusetts
Massachusetts provides a case study for transitioning from NSL-eligibility to direct certification as a determination for student poverty funding. In order to capture as many economically disadvantaged students as possible Massachusetts’ includes directly certified students participating in four means-tested government programs including SNAP, TANF, foster care, and the state Medicaid pilot, MassHealth. This test was based on the decision to reset the standard for economic disadvantage from under 185 percent of the federal poverty line, as defined under the previous test of NSL-eligibility, to under 133 percent of the federal poverty line. At the time of implementation, the state concluded that it could only match reliably across programs at the 133 percent threshold and not the broader 133 percent-185 percent range.
After proceeding with the new direct certification test, the state saw a 31.4 percent decrease in the number of students identified as economically disadvantaged. This significant drop has allowed Massachusetts to target students with more significant economic disadvantages. However, due to the previously stated fact that a number of families do not participate in public assistance programs, though they qualify, some disadvantaged students were not counted. In any case, reducing the number of students captured by the previous NSL-eligibility metric in this manner led the state to use a higher multiplier or weighting for each student now identified as eligible for attracting funding for economic disadvantage. This was implemented in Massachusetts alongside a ‘hold harmless’ provision which guaranteed school districts at least the same funding level that they would have received under the previous low-income measure, i.e. by applying the NSL-eligibility metric using data collected pre-transition.
In 2019, however, Massachusetts passed the Student Opportunity Act which raises the threshold for economic disadvantage back to 185 percent. This requires an expansion of the state’s direct certification methodology and the possible inclusion of additional means-tested public assistance programs in order to capture more students. For instance, MassHealth already identifies families under 133 percent of the federal poverty line as well as those situated between 133 percent and 185 percent of the federal poverty line. The state could opt to directly certify more students through an existing program by opting for the broader test.
Conclusion
While direct certification comes with its own share of challenges, it also offers a more accurate method of identifying student poverty than the traditional standard of NSL-eligibility. In addition to mitigating the technical challenges of the National School Lunch program certification process, states must weigh the advantages of capturing more students by widening the net of programs included under direct certification with the outcomes posited by identifying fewer students albeit allocating more funding for each.
States can also work with school districts and school administrators to identify and include ‘lost’ students who face disadvantages but may not be captured by the specific programs included under the state’s direct certification test. This would be especially helpful for capturing marginalized groups such as migrant students or transient youth who may not be represented in government databases for those programs. In doing so, schools could more effectively address student poverty by allocating already existing resources to the students who are most in need.
Notes:
*- MT and NM distribute funding for student poverty and poverty concentration on the basis of Title I eligibility which in-turn considers federal census data as well as direct certification for some public assistance programs.
*- NY calculates per-student funding for concentrated poverty using a ‘pupil need index’ which incorporates 65 percent of the students eligible for free or reduced-price lunch under the National School Lunch Program and 65 percent of the students from households below the federal poverty level according to federal census data.
*- NC uses a measure based on the district’s expected property tax revenue, its tax base per square mile, and its average per capita income, for both of its concentrated poverty-related funding streams to districts. NC also provides funding on the basis of federal Title-I eligibility.
*- OR uses federal census data. Namely, the Small Area Income Poverty Estimate (SAIPE) published by the Census Bureau. The SAIPE is a statistical model that compares data from several sources, including the U.S. Department of Agriculture’s Supplemental Nutritional Aid Program (SNAP), IRS tax returns and yearly Census Bureau survey data.
*- PA determines the number of students in the district who live in households earning between 100 percent and 184 percent of the federal poverty level using the most recent U.S. federal Census Bureau’s American Community Survey.
*- IN waives fees for NSL-eligible students and allocates poverty funding based on direct certification.
*- NV provides per-pupil state funding for poverty based on NSL-eligibility and separately provides program-specific grants to designated schools based on both low-performance and high poverty concentration as determined by federal census data.
*- TX ascertains the number of low-income students in a district using NSL-eligibility, then sets the funding multiplier applicable to those students based on the “level of economic disadvantage” in the census block in which the low-income student resides. This measure is calculated using federal census data.
Based on data obtained from “FundEd: Poverty Funding Policies in Each State” “FundEd: Concentrated Poverty Funding Policies in Each State”.
*- KS data obtained from “Measuring Student Poverty: Dishing Up Alternatives to Free and Reduced-Price Lunch”