

The recently released NAEP scores include data for 21 school districts as part of the Trial Urban District Assessment (TUDA) program. Three of these districts hail from the Lone Star state: Austin ISD, Dallas ISD, and Houston ISD.
Rather than compare district outcomes to state or national results, a large cities comparison group is provided as a benchmark. This group includes results for students in cities with populations of 250,000 or more. It has a higher concentration of low-income and minority students than the nation as a whole, making it especially valuable for comparisons to individual TUDA districts. Nearly half of large cities’ results are from students in TUDA districts.
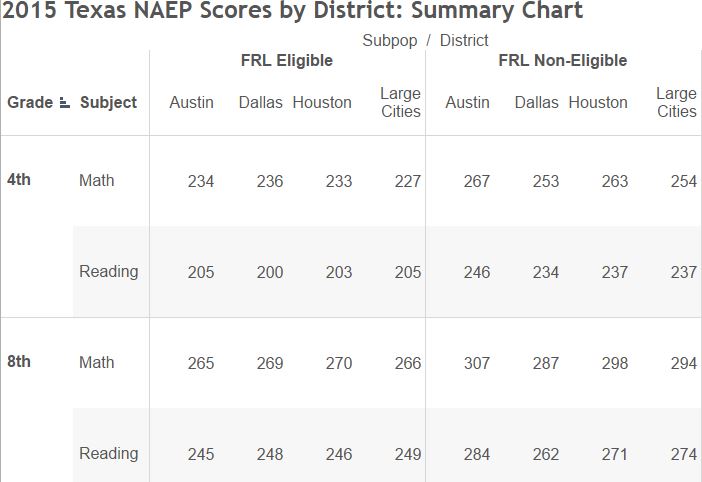
Additionally, it is useful to disaggregate results by eligibility for free or reduced-price lunch (FRL). This provides a more equitable comparison by (at least partially) accounting for differences in populations. It also allows us to better understand how districts are serving their low-income students. The following chart summarizes average NAEP scores for Texas districts and the large cities comparison group.
What can Texas districts learn from TUDA data? Here are four key takeaways with an interactive chart for you to explore.
I. The Achievement gap between FRL and Non-FRL students is (sadly) alive and well.
The achievement gap between FRL and Non-FRL students is quite large within all three districts (i.e. A district’s average Non-FRL score minus its average FRL score for each subject/grade level). The chart below summarizes the gap by test. Overall, only Dallas compares favorably to the large cities group as it has the lowest average gap.
| Subject | Austin | Dallas | Houston | Large Cities |
| 4th Math | 33 | 17 | 30 | 27 |
| 4th Reading | 41 | 34 | 34 | 32 |
| 8th Math | 42 | 18 | 28 | 28 |
| 8th Reading | 39 | 14 | 25 | 25 |
| Average | 38.7 | 20.7 | 29.2 | 28 |
II. Austin’s achievement gap is especially notable.
Overall, Austin’s average achievement gap is more than 38 points. Its average 8th grade FRL scores are the lowest in both math and reading. Conversely, Austin’s average Non-FRL scores are the highest across the board (i.e. both subjects and grade levels).
III. Texas districts are doing relatively well in math…
They’re outperforming the large cities comparison group in 9 of 12 categories (i.e. across districts, grade levels, subjects, FRL, and Non-FRL).
IV. …and not so well in reading.
Texas districts are underperforming the large cities comparison group in 8 of 12 categories. While this isn’t an entirely apples-to-apples comparison (e.g. it doesn’t account for ELL populations) it should be alarming nevertheless.
While the data presented above do not reflect whether districts are making strides in closing the achievement gap between FRL and Non-FRL students, it is evident that all three have a long way to go. Cosmetic tweaks in state and district policies will clearly not suffice in addressing this.
<a href=”><img alt=’Texas 2015 Dashboard ‘ src=’https://public.tableau.com/static/images/Te/Texas2015NAEPScoresbyDistrictSummaryChart/Texas2015Dashboard/1_rss.png’ style=’border: none’ /></a>