


This section of the Public Education at a Crossroads study begins by examining revenue trends and then provides expenditure data for the following spending categories: support services, instruction, employee benefits, capital expenditures, and debt.
As noted in an earlier section, nationwide, inflation-adjusted public school revenues grew from $12,852 per student in 2002 to $16,065 per student in 2020. These revenue figures include all local, state, and federal dollars for both operating and capital expenses.
Revenue Trends
Figure 4 shows nationwide revenue growth by funding source, and Table 7 shows revenue per student growth for all 50 states between 2002 and 2020. These data include federal, state, and local education dollars, and this time period was selected based on the availability of continuous state-level summary data from the U.S. Census Bureau.
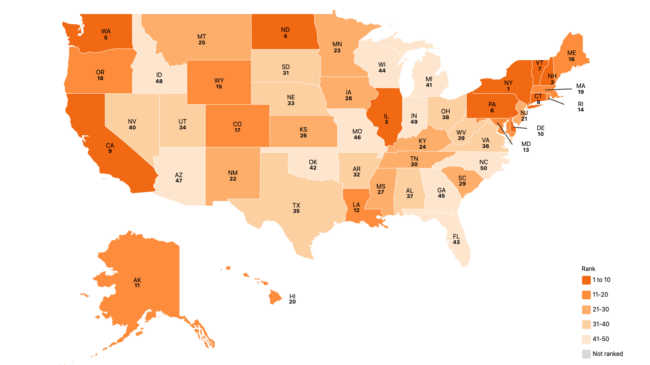
Nationwide, inflation-adjusted K-12 revenues grew by $3,213 per student or 25% between 2002 and 2020. During this time, nearly every state increased education funding, with per-student revenues increasing by at least 10% in 41 states and growth exceeding 50% in New York, New Hampshire, Illinois, North Dakota, and Washington.
Figure 4: U.S. Public Education Revenue Growth by Funding Source (2002-2020)

In 2020, education funding in nine states surpassed $20,000 per student, with New York topping the list at $30,723 per student, followed by Connecticut and New Jersey.
That year, per-student funding was the lowest in Idaho, Utah, and Mississippi. Importantly, cost-of-living differences might skew unadjusted comparisons of per-student funding levels across states. For instance, in 2020, Idaho spent the least on K-12 education ($9,802) but is a low-cost state compared to higher spenders such as New York, Illinois, and New Jersey.
Table 7: Total Revenue per Student Growth (2002-2020)
| Growth Rank | 2020 Rank | State | 2002 | 2020 | Growth |
|---|---|---|---|---|---|
| United States | $12,852 | $16,065 | 25.0% | ||
| 1 | 1 | New York | $18,054 | $30,723 | 70.2% |
| 2 | 8 | New Hampshire | $12,939 | $20,131 | 55.6% |
| 3 | 7 | Illinois | $13,054 | $20,195 | 54.7% |
| 4 | 19 | North Dakota | $10,992 | $16,624 | 51.2% |
| 5 | 15 | Washington | $11,776 | $17,685 | 50.2% |
| 6 | 5 | Pennsylvania | $14,435 | $21,524 | 49.1% |
| 7 | 4 | Vermont | $15,875 | $23,575 | 48.5% |
| 8 | 2 | Connecticut | $17,158 | $24,875 | 45.0% |
| 9 | 17 | California | $12,471 | $16,934 | 35.8% |
| 10 | 9 | Delaware | $14,896 | $20,032 | 34.5% |
| 11 | 10 | Alaska | $14,957 | $19,765 | 32.1% |
| 12 | 33 | Louisiana | $10,411 | $13,753 | 32.1% |
| 13 | 14 | Maryland | $14,135 | $18,581 | 31.4% |
| 14 | 11 | Rhode Island | $14,993 | $19,574 | 30.6% |
| 15 | 12 | Wyoming | $14,903 | $19,384 | 30.1% |
| 16 | 16 | Maine | $13,521 | $17,584 | 30.1% |
| 17 | 26 | Colorado | $11,322 | $14,496 | 28.0% |
| 18 | 22 | Oregon | $12,426 | $15,844 | 27.5% |
| 19 | 6 | Massachusetts | $16,755 | $21,276 | 27.0% |
| 20 | 13 | Hawaii | $14,785 | $18,756 | 26.9% |
| 21 | 3 | New Jersey | $18,969 | $24,010 | 26.6% |
| 22 | 27 | New Mexico | $11,437 | $14,394 | 25.9% |
| 23 | 18 | Minnesota | $13,421 | $16,762 | 24.9% |
| 24 | 37 | Kentucky | $10,194 | $12,715 | 24.7% |
| 25 | 32 | Montana | $11,051 | $13,769 | 24.6% |
| 26 | 25 | Kansas | $11,718 | $14,588 | 24.5% |
| 27 | 48 | Mississippi | $8,878 | $10,774 | 21.3% |
| 28 | 29 | Iowa | $12,017 | $14,310 | 19.1% |
| 29 | 28 | South Carolina | $12,038 | $14,324 | 19.0% |
| 30 | 44 | Tennessee | $9,268 | $10,971 | 18.4% |
| 31 | 38 | South Dakota | $10,533 | $12,410 | 17.8% |
| 32 | 40 | Arkansas | $10,081 | $11,828 | 17.3% |
| 33 | 24 | Nebraska | $12,545 | $14,717 | 17.3% |
| 34 | 49 | Utah | $8,607 | $10,027 | 16.5% |
| 35 | 36 | Texas | $11,473 | $13,346 | 16.3% |
| 36 | 31 | Virginia | $12,129 | $13,998 | 15.4% |
| 37 | 42 | Alabama | $10,192 | $11,729 | 15.1% |
| 38 | 20 | Ohio | $14,008 | $16,064 | 14.7% |
| 39 | 30 | West Virginia | $12,351 | $14,163 | 14.7% |
| 40 | 41 | Nevada | $10,472 | $11,755 | 12.3% |
| 41 | 21 | Michigan | $14,518 | $15,967 | 10.0% |
| 42 | 45 | Oklahoma | $10,141 | $10,956 | 8.0% |
| 43 | 43 | Florida | $10,707 | $11,526 | 7.6% |
| 44 | 23 | Wisconsin | $14,091 | $15,015 | 6.6% |
| 45 | 34 | Georgia | $12,803 | $13,605 | 6.3% |
| 46 | 39 | Missouri | $11,702 | $12,402 | 6.0% |
| 47 | 46 | Arizona | $10,353 | $10,790 | 4.2% |
| 48 | 50 | Idaho | $9,518 | $9,802 | 3.0% |
| 49 | 35 | Indiana | $13,116 | $13,368 | 1.9% |
| 50 | 47 | North Carolina | $10,806 | $10,790 | -0.1% |
Growth of Total K-12 Revenue per Student From 2002-2020
Expenditure Trends
1. Pupil Support Services
Table 8 shows expenditure trends broken down by support services, which includes spending on salaries, benefits, supplies, materials, and contractual services. (Note that some expenditures classified under support services—such as curriculum development and instructional development—are related to instruction, as discussed in Section 3.2.2 of the full report.)
The Census Bureau breaks down support service expenditures by seven primary functions, which are defined as follows:
- General Administration: Includes expenditures for board of education and executive administration services.
- Instructional Staff Support: Includes expenditures for instructional supervisors, curriculum development, instructional staff training, and other services.
- Operation and Maintenance of Plant: Includes expenditures for building services (e.g., HVAC), security, and upkeep of grounds and equipment.
- Pupil Support Services: Includes expenditures for social work, counseling, record-keeping, and several categories of services such as medical, dental, nursing, psychological, and speech.
- Pupil Transportation Services: Includes expenditures for transporting students and maintaining vehicles.
- School Administration: Includes expenditures for principal services.
- Other Support Services: Includes expenditures for central office support and business services such as research, development, data processing, budgeting, and purchasing.
Between 2002 and 2020, U.S. inflation-adjusted support service expenditures grew by $974 per student or 25.4%. A total of nine states saw increases of at least 50%, with New Hampshire, Hawaii, Vermont, Connecticut, and Washington all exceeding 60%.
At the other end of the spectrum, five states had growth rates below 10%—North Carolina, Florida, Oklahoma, Michigan, and Idaho. Idaho was the only state where per-student spending on support services did not increase during the time period examined.
Nationwide, pupil support services increased the most, as displayed in Figure 5. In 2020, New Jersey spent the most on support services at $8,027 per student, followed by Vermont at $7,895 per student and Alaska at $7,894 per student. Utah, Idaho, and North Carolina spent the least on support services per student that year.
Figure 5: Support Services Expenditure Growth by Function, National Average (2002-2020)
Table 8: Support Services Spending per Student Growth (2002-2020)
| Growth Rank | 2020 Rank | State | 2002 | 2020 | Growth |
|---|---|---|---|---|---|
| United States | $3,841 | $4,815 | 25.4% | ||
| 1 | 11 | New Hampshire | $3,726 | $6,280 | 68.6% |
| 2 | 12 | Hawaii | $3,582 | $6,001 | 67.5% |
| 3 | 2 | Vermont | $4,833 | $7,895 | 63.4% |
| 4 | 4 | Connecticut | $4,855 | $7,827 | 61.2% |
| 5 | 15 | Washington | $3,478 | $5,590 | 60.7% |
| 6 | 14 | Maine | $3,784 | $5,948 | 57.2% |
| 7 | 23 | North Dakota | $3,058 | $4,647 | 52.0% |
| 8 | 5 | New York | $4,759 | $7,213 | 51.6% |
| 9 | 9 | Illinois | $4,237 | $6,379 | 50.5% |
| 10 | 3 | Alaska | $5,267 | $7,894 | 49.9% |
| 11 | 6 | Delaware | $4,573 | $6,826 | 49.3% |
| 12 | 26 | Louisiana | $3,060 | $4,555 | 48.8% |
| 13 | 8 | Rhode Island | $4,466 | $6,446 | 44.3% |
| 14 | 10 | Wyoming | $4,482 | $6,283 | 40.2% |
| 15 | 17 | California | $3,753 | $5,190 | 38.3% |
| 16 | 44 | Mississippi | $2,569 | $3,547 | 38.1% |
| 17 | 38 | Arkansas | $2,926 | $3,992 | 36.4% |
| 18 | 13 | Pennsylvania | $4,435 | $5,967 | 34.5% |
| 19 | 7 | Massachusetts | $4,903 | $6,589 | 34.4% |
| 20 | 25 | South Carolina | $3,473 | $4,576 | 31.8% |
| 21 | 40 | Alabama | $2,812 | $3,700 | 31.6% |
| 22 | 50 | Utah | $2,054 | $2,690 | 31.0% |
| 23 | 46 | Tennessee | $2,613 | $3,418 | 30.8% |
| 24 | 27 | Montana | $3,442 | $4,468 | 29.8% |
| 25 | 30 | Nebraska | $3,388 | $4,397 | 29.8% |
| 26 | 16 | Maryland | $4,143 | $5,296 | 27.8% |
| 27 | 21 | Colorado | $3,829 | $4,878 | 27.4% |
| 28 | 37 | Kentucky | $3,143 | $3,995 | 27.1% |
| 29 | 28 | Missouri | $3,520 | $4,435 | 26.0% |
| 30 | 1 | New Jersey | $6,497 | $8,027 | 23.6% |
| 31 | 41 | Nevada | $2,990 | $3,691 | 23.5% |
| 32 | 24 | Virginia | $3,733 | $4,607 | 23.4% |
| 33 | 36 | Georgia | $3,281 | $4,010 | 22.2% |
| 34 | 32 | Iowa | $3,508 | $4,287 | 22.2% |
| 35 | 29 | West Virginia | $3,634 | $4,410 | 21.3% |
| 36 | 31 | Kansas | $3,671 | $4,394 | 19.7% |
| 37 | 20 | Oregon | $4,193 | $4,995 | 19.1% |
| 38 | 35 | Minnesota | $3,560 | $4,142 | 16.4% |
| 39 | 43 | Arizona | $3,081 | $3,563 | 15.6% |
| 40 | 34 | New Mexico | $3,671 | $4,215 | 14.8% |
| 41 | 42 | South Dakota | $3,170 | $3,637 | 14.7% |
| 42 | 18 | Ohio | $4,554 | $5,173 | 13.6% |
| 43 | 39 | Texas | $3,364 | $3,719 | 10.6% |
| 44 | 22 | Wisconsin | $4,290 | $4,731 | 10.3% |
| 45 | 33 | Indiana | $3,848 | $4,237 | 10.1% |
| 46 | 48 | North Carolina | $2,925 | $3,190 | 9.1% |
| 47 | 47 | Florida | $3,228 | $3,377 | 4.6% |
| 48 | 45 | Oklahoma | $3,344 | $3,481 | 4.1% |
| 49 | 19 | Michigan | $4,877 | $5,056 | 3.7% |
| 50 | 49 | Idaho | $2,924 | $2,924 | 0.0% |
Growth in Support Services Spending per Student (2002-2020)
2. Instruction
Table 9 shows expenditure trends for instruction, which includes spending on salaries, benefits, supplies, materials, and contractual services. In comparison, real spending per student on instruction grew at a lower rate than support services, averaging 20%, for an increase of $1,364 per student.
Four states saw increases of at least 50% for instruction— New Hampshire, New York, Hawaii, and Illinois—and per-pupil spending on instruction declined slightly in Indiana, Idaho, and Wisconsin.
In 2020, nine states spent more than $10,000 per student on instruction, with New York topping the list at $17,813 per student. Arizona, Idaho, and Utah spent the least on instruction that year.
Table 9: Instruction Spending per Student Growth (2002-2020)
| Growth Rank | 2020 Rank | State | 2002 | 2020 | Growth |
|---|---|---|---|---|---|
| United States | $6,819 | $8,183 | 20.0% | ||
| 1 | 6 | New Hampshire | $7,094 | $11,228 | 58.3% |
| 2 | 1 | New York | $11,473 | $17,813 | 55.3% |
| 3 | 12 | Hawaii | $6,378 | $9,806 | 53.7% |
| 4 | 8 | Illinois | $6,964 | $10,540 | 51.3% |
| 5 | 17 | North Dakota | $5,938 | $8,616 | 45.1% |
| 6 | 18 | Washington | $5,984 | $8,592 | 43.6% |
| 7 | 3 | Vermont | $8,729 | $12,457 | 42.7% |
| 8 | 2 | Connecticut | $9,044 | $12,880 | 42.4% |
| 9 | 7 | Pennsylvania | $7,855 | $10,577 | 34.6% |
| 10 | 5 | Massachusetts | $8,869 | $11,714 | 32.1% |
| 11 | 13 | Maryland | $7,522 | $9,783 | 30.1% |
| 12 | 10 | Wyoming | $7,620 | $9,899 | 29.9% |
| 13 | 23 | Kansas | $6,016 | $7,790 | 29.5% |
| 14 | 4 | New Jersey | $9,542 | $12,074 | 26.5% |
| 15 | 15 | Minnesota | $7,068 | $8,885 | 25.7% |
| 16 | 19 | California | $6,683 | $8,316 | 24.4% |
| 17 | 33 | New Mexico | $5,390 | $6,580 | 22.1% |
| 18 | 20 | Ohio | $6,730 | $8,213 | 22.0% |
| 19 | 14 | Alaska | $8,112 | $9,753 | 20.2% |
| 20 | 40 | Florida | $5,071 | $6,082 | 19.9% |
| 21 | 46 | Mississippi | $4,655 | $5,546 | 19.1% |
| 22 | 9 | Rhode Island | $8,416 | $10,023 | 19.1% |
| 23 | 11 | Delaware | $8,310 | $9,827 | 18.3% |
| 24 | 21 | Nebraska | $6,793 | $8,007 | 17.9% |
| 25 | 22 | Virginia | $6,674 | $7,828 | 17.3% |
| 26 | 31 | Kentucky | $5,734 | $6,665 | 16.2% |
| 27 | 26 | Oregon | $6,442 | $7,460 | 15.8% |
| 28 | 32 | Louisiana | $5,741 | $6,626 | 15.4% |
| 29 | 27 | Iowa | $6,270 | $7,194 | 14.7% |
| 30 | 48 | Utah | $4,612 | $5,281 | 14.5% |
| 31 | 29 | Montana | $6,300 | $7,131 | 13.2% |
| 32 | 16 | Maine | $7,870 | $8,828 | 12.2% |
| 33 | 36 | Colorado | $5,769 | $6,351 | 10.1% |
| 34 | 41 | South Dakota | $5,518 | $6,031 | 9.3% |
| 35 | 43 | Alabama | $5,405 | $5,883 | 8.8% |
| 36 | 50 | Arizona | $4,468 | $4,801 | 7.5% |
| 37 | 25 | Michigan | $7,015 | $7,535 | 7.4% |
| 38 | 42 | Tennessee | $5,596 | $5,977 | 6.8% |
| 39 | 44 | Arkansas | $5,450 | $5,810 | 6.6% |
| 40 | 47 | Oklahoma | $5,096 | $5,424 | 6.4% |
| 41 | 45 | Nevada | $5,438 | $5,748 | 5.7% |
| 42 | 34 | South Carolina | $6,063 | $6,393 | 5.4% |
| 43 | 37 | North Carolina | $5,948 | $6,270 | 5.4% |
| 44 | 30 | Georgia | $6,769 | $7,111 | 5.0% |
| 45 | 39 | Texas | $5,909 | $6,147 | 4.0% |
| 46 | 28 | West Virginia | $6,892 | $7,138 | 3.6% |
| 47 | 35 | Missouri | $6,173 | $6,364 | 3.1% |
| 48 | 24 | Wisconsin | $7,658 | $7,560 | -1.3% |
| 49 | 49 | Idaho | $5,255 | $4,975 | -5.3% |
| 50 | 38 | Indiana | $6,658 | $6,213 | -6.7% |
Growth in Instruction Spending per Student (2002-2020)
3. Employee Benefits
Benefit spending played a substantial role in the trends observed in both support services and instruction spending categories.
Overall, inflation-adjusted spending on employee benefits increased in all 50 states between 2002 and 2020, growing by $1,499 per student or 78.6% nationwide, as shown in Table 10. This Census expenditure category includes pensions, social security, health insurance, life insurance, worker’s compensation, unemployment compensation, and tuition reimbursement. Research suggests that much of this observed growth is driven by rising teacher pension costs due to unfunded liabilities accumulated over time.
A total of 14 states doubled their per-pupil spending on benefits, with three—Hawaii, Illinois, and Pennsylvania—seeing increases exceeding 170%. In comparison, four states had relatively modest growth rates below 20%—Wisconsin, Idaho, West Virginia, and Florida.
4. Capital Expenditures
Nationwide, inflation-adjusted capital expenditures grew by $129 per student or 7.9% between 2002 and 2020, as shown in Table 11. This Census reporting category includes building construction, building improvements, and equipment expenses but does not include maintenance and repairs.
Capital outlays per student decreased in nearly half of all states but more than doubled in eight states.
Table 10: Employee Benefit Spending per Student Growth (2002-2020)
| Growth Rank | 2020 Rank | State | 2002 | 2020 | Growth |
|---|---|---|---|---|---|
| United States | $ 1,907 | $ 3,406 | 78.6% | ||
| 1 | 8 | Hawaii | $ 1,392 | $ 5,014 | 260.2% |
| 2 | 4 | Illinois | $ 2,024 | $ 6,062 | 199.5% |
| 3 | 5 | Pennsylvania | $ 2,068 | $ 5,656 | 173.6% |
| 4 | 12 | New Hampshire | $ 1,919 | $ 4,639 | 141.8% |
| 5 | 1 | New York | $ 2,929 | $ 7,069 | 141.4% |
| 6 | 3 | Connecticut | $ 2,600 | $ 6,197 | 138.4% |
| 7 | 2 | New Jersey | $ 2,679 | $ 6,233 | 132.7% |
| 8 | 6 | Vermont | $ 2,447 | $ 5,618 | 129.6% |
| 9 | 7 | Alaska | $ 2,366 | $ 5,304 | 124.2% |
| 10 | 19 | Kentucky | $ 1,610 | $ 3,536 | 119.6% |
| 11 | 17 | California | $ 1,791 | $ 3,932 | 119.5% |
| 12 | 20 | Washington | $ 1,597 | $ 3,483 | 118.1% |
| 13 | 34 | Colorado | $ 1,213 | $ 2,493 | 105.5% |
| 14 | 23 | North Dakota | $ 1,633 | $ 3,294 | 101.7% |
| 15 | 25 | Louisiana | $ 1,634 | $ 3,243 | 98.4% |
| 16 | 32 | Kansas | $ 1,364 | $ 2,622 | 92.2% |
| 17 | 9 | Delaware | $ 2,592 | $ 4,958 | 91.3% |
| 18 | 11 | Massachusetts | $ 2,575 | $ 4,769 | 85.2% |
| 19 | 10 | Rhode Island | $ 2,731 | $ 4,901 | 79.4% |
| 20 | 36 | North Carolina | $ 1,306 | $ 2,340 | 79.2% |
| 21 | 13 | Wyoming | $ 2,503 | $ 4,484 | 79.1% |
| 22 | 22 | Virginia | $ 1,872 | $ 3,303 | 76.4% |
| 23 | 16 | Maryland | $ 2,357 | $ 4,035 | 71.2% |
| 24 | 49 | Arizona | $ 1,018 | $ 1,710 | 67.9% |
| 25 | 30 | Nebraska | $ 1,819 | $ 2,856 | 57.0% |
| 26 | 15 | Oregon | $ 2,630 | $ 4,124 | 56.8% |
| 27 | 43 | Tennessee | $ 1,273 | $ 1,992 | 56.5% |
| 28 | 28 | Minnesota | $ 1,920 | $ 2,981 | 55.2% |
| 29 | 14 | Michigan | $ 2,776 | $ 4,286 | 54.4% |
| 30 | 39 | Missouri | $ 1,473 | $ 2,267 | 53.9% |
| 31 | 42 | Mississippi | $ 1,315 | $ 2,020 | 53.6% |
| 32 | 35 | Nevada | $ 1,623 | $ 2,487 | 53.3% |
| 33 | 31 | South Carolina | $ 1,825 | $ 2,772 | 51.9% |
| 34 | 44 | Oklahoma | $ 1,249 | $ 1,864 | 49.3% |
| 35 | 40 | Utah | $ 1,524 | $ 2,255 | 48.0% |
| 36 | 37 | New Mexico | $ 1,579 | $ 2,319 | 46.9% |
| 37 | 29 | Georgia | $ 2,062 | $ 2,963 | 43.7% |
| 38 | 26 | Ohio | $ 2,240 | $ 3,174 | 41.7% |
| 39 | 38 | Alabama | $ 1,621 | $ 2,281 | 40.7% |
| 40 | 33 | Iowa | $ 1,915 | $ 2,596 | 35.6% |
| 41 | 48 | Arkansas | $ 1,302 | $ 1,753 | 34.7% |
| 42 | 41 | Montana | $ 1,659 | $ 2,227 | 34.3% |
| 43 | 18 | Maine | $ 2,791 | $ 3,743 | 34.1% |
| 44 | 45 | South Dakota | $ 1,389 | $ 1,815 | 30.7% |
| 45 | 50 | Texas | $ 1,044 | $ 1,295 | 24.0% |
| 46 | 24 | Indiana | $ 2,696 | $ 3,252 | 20.6% |
| 47 | 47 | Florida | $ 1,515 | $ 1,791 | 18.2% |
| 48 | 21 | West Virginia | $ 2,900 | $ 3,390 | 16.9% |
| 49 | 46 | Idaho | $ 1,652 | $ 1,800 | 8.9% |
| 50 | 27 | Wisconsin | $ 2,990 | $ 3,106 | 3.9% |
Growth in Employee Benefit Spending per Student (2002-2020)
Table 11: Capital Outlay Spending per Student Growth (2002-2020)
| Growth Rank | 2020 Rank | State | 2002 | 2020 | Growth |
|---|---|---|---|---|---|
| United States | $ 1,620 | $ 1,749 | 7.9% | ||
| 1 | 33 | Kentucky | $ 323 | $ 1,254 | 288.7% |
| 2 | 43 | Rhode Island | $ 249 | $ 941 | 278.0% |
| 3 | 41 | Hawaii | $ 330 | $ 1,089 | 230.5% |
| 4 | 9 | Montana | $ 670 | $ 2,101 | 213.5% |
| 5 | 5 | North Dakota | $ 783 | $ 2,434 | 210.8% |
| 6 | 12 | Kansas | $ 711 | $ 1,958 | 175.2% |
| 7 | 1 | Oregon | $ 1,462 | $ 3,358 | 129.6% |
| 8 | 2 | Washington | $ 1,484 | $ 3,094 | 108.5% |
| 9 | 25 | Arkansas | $ 769 | $ 1,536 | 99.7% |
| 10 | 7 | Iowa | $ 1,365 | $ 2,210 | 61.9% |
| 11 | 10 | Indiana | $ 1,271 | $ 1,994 | 56.9% |
| 12 | 39 | Oklahoma | $ 794 | $ 1,159 | 46.0% |
| 13 | 8 | Colorado | $ 1,517 | $ 2,164 | 42.7% |
| 14 | 3 | Minnesota | $ 2,205 | $ 3,036 | 37.7% |
| 15 | 19 | Utah | $ 1,281 | $ 1,763 | 37.7% |
| 16 | 37 | Mississippi | $ 879 | $ 1,170 | 33.2% |
| 17 | 32 | Maine | $ 966 | $ 1,277 | 32.2% |
| 18 | 16 | Wisconsin | $ 1,423 | $ 1,853 | 30.2% |
| 19 | 15 | Wyoming | $ 1,520 | $ 1,890 | 24.3% |
| 20 | 13 | Maryland | $ 1,579 | $ 1,933 | 22.4% |
| 21 | 11 | California | $ 1,646 | $ 1,994 | 21.2% |
| 22 | 6 | Texas | $ 1,896 | $ 2,233 | 17.7% |
| 23 | 23 | Connecticut | $ 1,425 | $ 1,607 | 12.8% |
| 24 | 4 | New York | $ 2,440 | $ 2,746 | 12.6% |
| 25 | 28 | Missouri | $ 1,311 | $ 1,416 | 8.0% |
| 26 | 18 | New Mexico | $ 1,683 | $ 1,786 | 6.1% |
| 27 | 17 | South Dakota | $ 1,697 | $ 1,786 | 5.3% |
| 28 | 21 | Ohio | $ 1,711 | $ 1,718 | 0.4% |
| 29 | 20 | Nebraska | $ 1,854 | $ 1,762 | -5.0% |
| 30 | 46 | Louisiana | $ 882 | $ 829 | -6.0% |
| 31 | 44 | West Virginia | $ 996 | $ 936 | -6.0% |
| 32 | 14 | South Carolina | $ 2,050 | $ 1,908 | -6.9% |
| 33 | 36 | Virginia | $ 1,401 | $ 1,173 | -16.3% |
| 34 | 47 | Alabama | $ 986 | $ 825 | -16.3% |
| 35 | 26 | Pennsylvania | $ 1,833 | $ 1,530 | -16.5% |
| 36 | 29 | Arizona | $ 1,624 | $ 1,352 | -16.8% |
| 37 | 42 | North Carolina | $ 1,263 | $ 1,049 | -16.9% |
| 38 | 31 | Georgia | $ 1,629 | $ 1,325 | -18.7% |
| 39 | 35 | New Jersey | $ 1,527 | $ 1,191 | -22.0% |
| 40 | 30 | Massachusetts | $ 1,738 | $ 1,348 | -22.5% |
| 41 | 49 | Idaho | $ 984 | $ 760 | -22.7% |
| 42 | 24 | Illinois | $ 2,037 | $ 1,556 | -23.6% |
| 43 | 50 | Vermont | $ 972 | $ 742 | -23.7% |
| 44 | 27 | Michigan | $ 1,965 | $ 1,430 | -27.2% |
| 45 | 22 | Nevada | $ 2,448 | $ 1,672 | -31.7% |
| 46 | 40 | Florida | $ 1,733 | $ 1,151 | -33.6% |
| 47 | 48 | Tennessee | $ 1,227 | $ 812 | -33.8% |
| 48 | 45 | New Hampshire | $ 1,329 | $ 842 | -36.7% |
| 49 | 34 | Delaware | $ 2,000 | $ 1,224 | -38.8% |
| 50 | 38 | Alaska | $ 2,339 | $ 1,161 | -50.3% |
Growth in Capital Outlay Spending per Student (2002-2020)
5. Total Debt per Student
Table 12 summarizes total debt obligations, which do not include retirement obligations. Overall, per-student debt in the U.S. increased by $3,811 per student, growing by 55%.
Five states—Indiana, Montana, Rhode Island, California, and North Dakota—saw per-student debt grow by more than 200%, while 11 states saw this figure decline.
Table 12: Total Debt per Student Growth (2002-2020)
| Growth Rank | 2020 Rank | State | 2002 | 2020 | Growth |
|---|---|---|---|---|---|
| United States | $ 6,932 | $ 10,743 | 55.0% | ||
| 1 | 16 | Indiana | $ 2,125 | $ 10,481 | 393.2% |
| 2 | 15 | Montana | $ 2,388 | $ 10,515 | 340.4% |
| 3 | 30 | Rhode Island | $ 1,729 | $ 6,607 | 282.2% |
| 4 | 5 | California | $ 4,293 | $ 15,636 | 264.3% |
| 5 | 25 | North Dakota | $ 2,288 | $ 7,444 | 225.4% |
| 6 | 36 | Delaware | $ 2,449 | $ 6,139 | 150.7% |
| 7 | 14 | Arkansas | $ 4,972 | $ 11,467 | 130.6% |
| 8 | 22 | Iowa | $ 3,840 | $ 8,704 | 126.7% |
| 9 | 3 | Oregon | $ 8,008 | $ 16,706 | 108.6% |
| 10 | 13 | Nebraska | $ 5,540 | $ 11,547 | 108.4% |
| 11 | 35 | Maryland | $ 3,209 | $ 6,145 | 91.5% |
| 12 | 20 | Kentucky | $ 4,673 | $ 8,868 | 89.8% |
| 13 | 1 | Texas | $ 10,051 | $ 19,009 | 89.1% |
| 14 | 27 | Alabama | $ 3,889 | $ 7,116 | 83.0% |
| 15 | 26 | New Mexico | $ 4,035 | $ 7,336 | 81.8% |
| 16 | 28 | Maine | $ 3,986 | $ 7,054 | 77.0% |
| 17 | 18 | Ohio | $ 5,310 | $ 9,190 | 73.1% |
| 18 | 21 | South Dakota | $ 5,190 | $ 8,819 | 69.9% |
| 19 | 9 | South Carolina | $ 7,911 | $ 12,870 | 62.7% |
| 20 | 45 | Oklahoma | $ 2,429 | $ 3,814 | 57.0% |
| 21 | 8 | Kansas | $ 8,719 | $ 13,461 | 54.4% |
| 22 | 33 | Utah | $ 4,130 | $ 6,187 | 49.8% |
| 23 | 7 | Washington | $ 9,361 | $ 13,818 | 47.6% |
| 24 | 24 | Missouri | $ 5,785 | $ 8,406 | 45.3% |
| 25 | 2 | Minnesota | $ 12,868 | $ 17,759 | 38.0% |
| 26 | 12 | Illinois | $ 8,787 | $ 11,722 | 33.4% |
| 27 | 40 | Idaho | $ 4,031 | $ 5,258 | 30.5% |
| 28 | 11 | Colorado | $ 9,736 | $ 12,160 | 24.9% |
| 29 | 10 | New York | $ 10,207 | $ 12,488 | 22.3% |
| 30 | 34 | Tennessee | $ 5,039 | $ 6,165 | 22.3% |
| 31 | 23 | Alaska | $ 6,992 | $ 8,463 | 21.0% |
| 32 | 6 | Michigan | $ 12,831 | $ 15,377 | 19.8% |
| 33 | 37 | North Carolina | $ 4,832 | $ 5,609 | 16.1% |
| 34 | 41 | Louisiana | $ 4,441 | $ 5,126 | 15.4% |
| 35 | 43 | Mississippi | $ 4,012 | $ 4,454 | 11.0% |
| 36 | 31 | Connecticut | $ 5,938 | $ 6,590 | 11.0% |
| 37 | 4 | Pennsylvania | $ 14,441 | $ 15,717 | 8.8% |
| 38 | 19 | Wisconsin | $ 9,041 | $ 9,186 | 1.6% |
| 39 | 48 | West Virginia | $ 1,090 | $ 1,072 | -1.7% |
| 40 | 46 | Vermont | $ 3,657 | $ 3,541 | -3.2% |
| 41 | 42 | Florida | $ 5,142 | $ 4,940 | -3.9% |
| 42 | 32 | Arizona | $ 6,970 | $ 6,550 | -6.0% |
| 43 | 38 | Virginia | $ 6,326 | $ 5,559 | -12.1% |
| 44 | 29 | Massachusetts | $ 7,977 | $ 6,757 | -15.3% |
| 45 | 44 | New Hampshire | $ 5,361 | $ 4,438 | -17.2% |
| 46 | 47 | Georgia | $ 3,800 | $ 2,989 | -21.3% |
| 47 | 39 | New Jersey | $ 6,935 | $ 5,421 | -21.8% |
| 48 | 17 | Nevada | $ 13,152 | $ 10,046 | -23.6% |
| 49 | 49 | Wyoming | $ 2,301 | $ 463 | -79.9% |
| Hawaii23 | $ - | $ - |
Growth in Total Debt per Student (2002-2020)
Full Study — Public Education at a Crossroads: A Comprehensive Look at K-12 Resources and Outcomes