


Full Study: Public Education at a Crossroads
Detailed Reports for All 50 States
Introduction
Public education is grappling with an unprecedented set of challenges in the wake of the COVID-19 pandemic. For starters, nationwide public school enrollment is down by over 1.2 million students compared with pre-pandemic levels, including losses exceeding 5% in New York, Oregon, and Mississippi.
Research suggests that families are increasingly choosing homeschooling or private schools, with demographic factors—such as drops in school-age populations—also contributing to enrollment declines. Because states generally tie funding to student counts, this could have substantial effects on school district budgets.
Students also fell behind during COVID-19, with 2022 National Assessment of Educational Progress results showing historic losses for 4th and 8th graders in both reading and math.
“The breadth of the declines across states is breathtaking,” concluded Mark Schneider, the director of the U.S. Department of Education’s Institute of Education Sciences. These losses were especially steep for students who were already behind their peers, and Stanford University’s Eric Hanushek estimates they could result in 5.6% lower lifetime earnings on average.
Additionally, school districts are heading toward a fiscal cliff when $190 billion in K-12 federal relief funding expires in 2024. Available data suggest that many have used these temporary dollars to plug budget holes and make permanent commitments, such as pay raises and hiring new staff, which will prove untenable in the coming years. Absent substantial funding boosts, staff layoffs and school closures could be on the horizon for these school districts.
Labor strife has also shut down classrooms in places such as Los Angeles, Minneapolis, and Columbus, with teacher salaries shaping up to be an important topic on the campaign trail ahead of the 2024 elections, as inflation continues to eat up paychecks. In his 2023 State of the Union address, President Joe Biden remarked, “Let’s give public school teachers a raise,” and Sen. Bernie Sanders recently introduced legislation that would boost teacher salaries nationwide. According to Sen. Sanders, “No public school teacher in America should make less than $60,000 a year.”
But even against the backdrop of battles over public school curricula—and fears of economic recession—legislatures in both red and blue states have made sizable investments in public school funding, including teacher salaries.
Finally, as school choice gains in popularity—states such as Arkansas, Iowa, and Utah adopted comprehensive programs in 2023—public schools must adapt to a more competitive environment that increasingly values personalization over standardization. A survey by Tyton Partners indicates that more than half of parents now want to lead and tailor their child’s education, with 79% believing that learning should happen beyond just classroom walls.
Public schools must become more responsive to students’ needs or risk further enrollment losses, especially as students gain access to options that offer greater customization.
Putting it all together—enrollment declines, learning loss, unsustainable budgets, union activism, curricular battles, and the rise of school choice—public education is clearly at a crossroads, and the decisions made today will shape generations to come. To be sure, much has changed since 2020 when the COVID-19 pandemic swept the nation, but pre-pandemic education trends provide policymakers with a critical anchor for navigating post-pandemic decisions.
About This Study: Public Education at a Crossroads
The primary objective of this study, Public Education at a Crossroads, is to provide a comprehensive snapshot of K-12 public education resources and outcomes so that policymakers are better equipped to make these choices. By bringing together key revenue, expenditure, enrollment, staffing, and student performance data from the past two decades, this report gives stakeholders in all 50 states a solid foundation for assessing public education trends at a crucial moment. Looking forward, they should use this information to ask important questions like what their goals are for students and whether resources are being deployed toward those aims.
Importantly, this study is geared toward shining light on the school finance decisions made by state and school district officials over time, and not evaluating the degree to which those decisions have been effective. Nevertheless, longitudinal outcomes on the National Assessment of Education Progress (NAEP) exams are included since they are a straightforward and common way to measure student progress. While these data have limitations, they serve as a useful barometer for student achievement and how public schools are performing. Because student demographics vary considerably across states, NAEP data for low-income students are provided to allow for more meaningful comparisons.
Similarly, state rankings are provided for context, so that readers can easily compare where states stand in relation to each other and the U.S. average on various metrics. The timeframe considered in this study—2002 to 2020—was selected based on the availability of state-level school finance summary data from the U.S. Census Bureau at the time of writing.
The study starts by presenting an analysis of nationwide and state-level data, including five key trends with public education resources and outcomes. It is then divided into three sections, which provide a more granular look at the data and state rankings: revenue and expenditures, enrollment and staffing, and student outcomes. This is then followed by a detailed overview of our methodology, concluding with state appendices, which summarize the key trends and rankings for all 50 states.
Note that these rankings aren’t necessarily ordered from best to worst and are subject to interpretation. For instance, some readers might interpret a high ranking in per student revenue growth as positive, while others will view this more skeptically.
Analysis: National Snapshot and Key Trends
Nationwide, inflation-adjusted public school revenues grew from $12,852 per student in 2002 to $16,065 per student in 2020, as displayed in Table 1. These revenue figures include all local, state, and federal dollars for both operating and capital expenses. Available data suggest there were two key drivers of this increase: employee benefits and new staffing positions. Benefit spending grew by 78.6% per student—or $1,499 per student—while growth in public school staff increased by 13.2%, outpacing a 6.6% increase in student enrollment.
For context, public schools added staff (779,107) to their payrolls equivalent to a quarter of enrollment growth (3,124,575). About three-quarters of this staffing increase was accounted for by non-teachers, which in 2020 comprised 52.1% of public school staff across the U.S. Notably, average inflation-adjusted teacher salaries decreased between 2002 and 2020, going from $64,522 to $64,133. Table 1 summarizes these trends.
Table 1: Key U.S. Public School Spending, Staffing, and Enrollment Trends (2002-2020, Inflation-Adjusted)
| Category | 2002 | 2020 | Growth |
|---|---|---|---|
| Revenue Per Student | $ 12,852 | $ 16,065 | 25.0% |
| Benefit Spending Per Student | $ 1,907 | $ 3,406 | 78.6% |
| Student Enrollment | 47,671,870 | 50,796,445 | 6.6% |
| Total Staff | 5,904,195 | 6,683,302 | 13.2% |
| Non-Teachers | 2,904,667 | 3,485,132 | 20.0% |
| Teachers | 2,999,528 | 3,198,170 | 6.6% |
| Average Teacher Salaries | $ 64,522 | $ 64,133 | -0.6% |
Student assessment results on the National Assessment of Educational Progress (NAEP) can shine a light on academic progress during a similar period. Table 2 summarizes NAEP score growth across six exams on the administration dates that most closely match the spending, staffing, and enrollment data.
Overall, reading scores were largely flat across all grade levels, while math scores showed improvement in grades 4 and 8 but then flattened for 12th graders. For low-income students, indicated by the free or reduced-price lunch program (“FRL” in Table 2) proxy, reading scores grew for 4th and 8th graders but declined for 12th graders. Math scores for low-income students grew across all three grade levels.
Table 2: U.S. NAEP Score Growth by Subject
| Student Group | 4th Grade Reading (2003-2019) | 4th Grade Math (2003-2019) | 8th Grade Reading (2003-2019) | 8th Grade Math (2003-2019) | 12th Grade Reading (2002-2019) | 12th Grade Math (2005-2019) |
|---|---|---|---|---|---|---|
| All | 2 | 6 | 0 | 4 | -1 | 0 |
| FRL Eligible Only | 6 | 7 | 3 | 7 | -2 | 4 |
These national observations, combined with state-level data, reveal five key trends during the period examined.
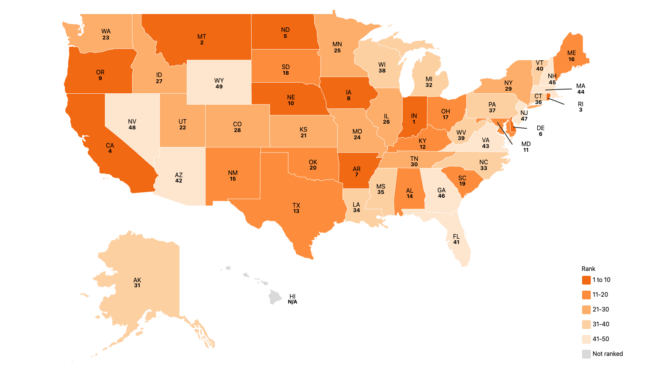
Key Trend #1: Education funding is up in nearly every state.
Between 2002 and 2020, 49 of 50 states saw real increases in revenue per student, with funding growth exceeding 50% in five states—New York, New Hampshire, Illinois, North Dakota, and Washington. Notably, all three levels of government increased public education funding, with nationwide federal, state, and local contributions per student, growing by 20.2%, 18.9%, and 32.9%, respectively. In 2020, education funding in nine states surpassed $20,000 per student, with New York topping the list at $30,723 per student.
Why It Matters: Public education revenue per student has almost invariably grown in inflation-adjusted terms since 2002. States differed significantly in the level of additional funding during this timeframe and there was a period of declining or stagnant revenue in the aftermath of the Great Recession, but the fact remains that education spending has consistently increased nationwide and was at historic levels even before the COVID-19 pandemic.
Key Trend #2: Teacher salary growth lagged funding growth in all 50 states.
Nationwide, total inflation-adjusted education dollars increased by 25% per student while average teacher salaries fell by 0.6% from 2002 to 2020. Table 3 summarizes this comparison for the top 10 states in funding growth, ranging from 34.5% per student in Delaware to 70.2% per student in New York. Of these states, real average teacher salaries declined in three—Illinois, Pennsylvania, and Delaware—and were fairly flat in New Hampshire and Connecticut. Notably, Illinois’ inflation-adjusted per-student revenue increased by $7,141 while its real average teacher salary fell by $3,301.
Figure 1: U.S. Revenue per Student Growth vs. Average Teacher Salary Growth (2002-2020, Inflation Adjusted)

Because teachers are paid based primarily on years of experience, a decline in average teacher tenure might contribute to the trend of flat or declining real salaries in some states. However, national data published by NCES suggest that average teacher salaries have been largely flat over time, even when comparing teachers with similar years of experience.
Table 3: Average Teacher Salary Growth for the Top 10 States in Funding Growth
| State | Total Revenue Per Student 2002 | Total Revenue Per Student 2020 | Total Revenue Per Student Growth | Average Teacher Salary 2002 | Average Teacher Salary 2020 | Average Teacher Salary Growth |
|---|---|---|---|---|---|---|
| New York | $18,054 | $30,723 | 70.2% | $75,088 | $87,069 | 16.0% |
| New Hampshire | $12,939 | $20,131 | 55.6% | $57,637 | $59,622 | 3.4% |
| Illinois | $13,054 | $20,195 | 54.7% | $71,384 | $68,083 | -4.6% |
| North Dakota | $10,992 | $16,624 | 51.2% | $46,573 | $53,525 | 14.9% |
| Washington | $11,776 | $17,685 | 50.2% | $62,762 | $76,743 | 22.3% |
| Pennsylvania | $14,435 | $21,524 | 49.1% | $73,065 | $70,339 | -3.7% |
| Vermont | $15,875 | $23,575 | 48.5% | $56,663 | $61,108 | 7.8% |
| Connecticut | $17,158 | $24,875 | 45.0% | $77,328 | $78,427 | 1.4% |
| California | $12,471 | $16,934 | 35.8% | $78,479 | $84,531 | 7.7% |
| Delaware | $14,896 | $20,032 | 34.5% | $69,836 | $64,853 | -7.1% |
Why It Matters: Sizable increases in education funding in many states have not translated into higher teacher salaries. Stagnant salaries, combined with high levels of inflation, could increase pressure on policymakers to increase education funding even more even though past increases often haven’t improved teacher pay.
Key Trend #3: Public school staffing growth is far outpacing student enrollment growth.
Between 2002 and 2020, U.S. public school enrollment increased by 6.6% while total staff grew by 13.2%. At the state level, staffing growth exceeded student growth in 39 of 50 states. Much of this can be attributed to growth in non-teaching staff, which increased by 20% across states. For context, the bulk of non-teachers in 2020—about 59.8%—were classified by NCES as Other Support Services Staff and Instructional Aides, with only about 10.8% classified as district-level staff. In other words, many non-teachers are school-level employees.
Table 4 summarizes staffing growth for the 10 states with the largest enrollment declines, which ranged from 6.2% to 14.3%. Notably, total staff increased in eight of these states. For instance, Connecticut’s total staff grew by 14.1% while its student enrollment declined by 8.2%.
Figure 2: Public School Staffing vs. Student Enrollment Growth (2002-2020)

Table 3: Staffing Trends for the Top 10 Enrollment Decline States
| State | Student Enrollment 2002 | Student Enrollment 2020 | Student Enrollment Growth | Public School Total Staff Growth | Public School Non-Teacher Growth | Public School Teacher Growth |
|---|---|---|---|---|---|---|
| New Hampshire | 206,847 | 177,351 | -14.3% | 9.9% | 19.8% | 0.1% |
| Vermont | 101,179 | 86,759 | -14.3% | 3.6% | 12.2% | -6.0% |
| Michigan | 1,730,669 | 1,459,925 | -13.6% | -10.7% | -7.7% | -14.2% |
| Maine | 205,586 | 180,291 | -12.3% | 7.3% | 25.4% | -11.4% |
| Rhode Island | 158,046 | 143,557 | -9.2% | 10.4% | 31.2% | -3.6% |
| Connecticut | 570,228 | 523,690 | -8.2% | 14.1% | 26.4% | 1.5% |
| Ohio* | 1,830,985 | 1,689,867 | -7.7% | 48.0% | 117.3% | -13.2% |
| West Virginia | 282,885 | 263,486 | -6.9% | -1.1% | 5.0% | -6.4% |
| New York | 2,872,132 | 2,692,589 | -6.3% | 0.7% | -2.5% | 4.0% |
| Illinois | 2,071,391 | 1,943,117 | -6.2% | 0.7% | -1.2% | 2.5% |
Why It Matters: A prevailing trend across states is to add new staff, regardless of enrollment levels. Although this trend is decades in the making, many school districts will face tough fiscal decisions in the coming year when federal COVID-19 relief funding dries up, especially given the magnitude of recent enrollment losses. This could lead to widespread school closures, layoffs, and other measures as district officials are forced to right-size operations. Legislators will also face pressure to increase funding as a way to avoid these difficult decisions.
Key Trend #4: Education dollars are increasingly going toward spending on employee benefits.
Nationwide, real spending on employee benefits increased by $1,499 per student, or 78.6%, from 2002 to 2020. Table 5 shows the top 10 states for growth in benefit spending per student, with all states more than doubling spending on this Census expenditure category that includes pensions, social security, health insurance, life insurance, worker’s compensation, unemployment compensation, and tuition reimbursement. Revenue growth per student is included in the table to show how this relates to overall funding growth in each state. Notice that, in six of the 10 states, benefit spending growth represented over half of their revenue increases, with nearly all of Hawaii’s per-student funding growth going to this expense category alone.
Table 5: Benefit Spending Per Student Growth vs. Total Revenue Per Student Growth
| State | 2002 | 2020 | Growth | Growth Per Student | Total Revenue Growth Per Student | Benefit Spending Growth as a Share of Revenue Growth |
|---|---|---|---|---|---|---|
| Hawaii | $1,392 | $5,014 | 260.2% | $3,622 | $3,971 | 91.2% |
| Illinois | $2,024 | $6,062 | 199.5% | $4,038 | $7,141 | 56.5% |
| Pennsylvania | $2,068 | $5,656 | 173.6% | $3,589 | $7,089 | 50.6% |
| New Hampshire | $1,919 | $4,639 | 141.8% | $2,720 | $7,191 | 37.8% |
| New York | $2,929 | $7,069 | 141.4% | $4,140 | $12,670 | 32.7% |
| Connecticut | $2,600 | $6,197 | 138.4% | $3,597 | $7,717 | 46.6% |
| New Jersey | $2,679 | $6,233 | 132.7% | $3,554 | $5,041 | 70.5% |
| Vermont | $2,447 | $5,618 | 129.6% | $3,171 | $7,700 | 41.2% |
| Alaska | $2,366 | $5,304 | 124.2% | $2,938 | $4,808 | 61.1% |
| Kentucky | $1,610 | $3,536 | 119.6% | $1,926 | $2,521 | 76.4% |
Why It Matters: Education dollars are increasingly devoted to covering employee benefits. Notably, many of the states with the highest increases in education revenue also saw the highest increases in benefit spending. Research shows that pension debt is a primary driver of this trend, with Equable Institute estimating $878 billion in unfunded liabilities nationwide. As a result, more funding is going to cover pension costs, even while states have reduced benefits for teachers.
Key Trend #5: There isn’t a consistent relationship between funding growth and outcomes across states.
There isn’t a consistent relationship between funding growth and student achievement, even when students’ income status is accounted for. Table 6 compares NAEP score growth for 2003-2019 in three high funding-growth states with three low funding-growth states. Because NAEP administration dates don’t align with the period otherwise examined in this study (2002-2020), inflation-adjusted revenue figures for 2003-2019 are provided for each state in Appendix 1 and used in Table 6. This allows for accurate comparisons between funding growth and NAEP score growth.
Notably, New York had a substantial increase in per student funding, but its scores were largely flat, including declines in both 4th and 8th-grade reading. The lone bright spot for the Empire State was a four-point increase in 8th-grade math for low-income students. In comparison, Idaho saw increases across all subjects, including positive gains for its low-income students, without increasing its per-student funding. Compared to its neighboring state of Washington (a high funding-growth state), students in the Gem State achieved the same or better growth across all subjects.
To be sure, low-income students in Illinois—where per student funding growth was among the highest in the nation—demonstrated impressive NAEP gains. However, these NAEP increases are similar to those observed for low-income students in Arizona, which posted the largest NAEP increases for its overall student population despite a funding increase of only 1.4%.
Table 6: NAEP Score Growth for Three High and Low Funding-Growth States
| State | 2003 | 2019 | Funding Growth | All Students (2003-2019) 4th Grade Reading | All Students (2003-2019) 4th Grade Math | All Students (2003-2019) 8th Grade Reading | All Students (2003-2019) 8th Grade Math | FRL Eligible Students (2003-2019) 4th Grade Reading | FRL Eligible Students (2003-2019) 4th Grade Math | FRL Eligible Students (2003-2019) 8th Grade Reading | FRL Eligible Students (2003-2019) 8th Grade Math |
|---|---|---|---|---|---|---|---|---|---|---|---|
| New York | $18,580 | $30,313 | 63.1% | -3 | 1 | -4 | 1 | -1 | 1 | 1 | 4 |
| Illinois | $13,081 | $19,299 | 47.5% | 2 | 5 | -2 | 5 | 8 | 11 | 2 | 13 |
| Washington | $11,897 | $17,518 | 47.2% | -1 | 1 | 2 | 5 | -2 | 2 | 1 | 3 |
| Arizona | $10,329 | $10,478 | 1.4% | 7 | 9 | 4 | 9 | 8 | 9 | 7 | 12 |
| North Carolina | $10,646 | $10,720 | 0.7% | 0 | -1 | 1 | 2 | 2 | 1 | 3 | 5 |
| Idaho | $9,579 | $9,441 | -1.4% | 4 | 7 | 2 | 6 | 4 | 6 | 1 | 4 |
Figure 3: NAEP Score Growth for Low-income Students for High and Low Funding-Growth States (2003-2019)

Why It Matters: These trends indicate that further statewide investments in public education don’t automatically lead to increased student achievement on standardized tests. Factors beyond overall per-student spending can lead to performance gains in states with low spending growth and can hold achievement flat in states with high spending growth.
Full Study — Public Education at a Crossroads: A Comprehensive Look at K-12 Resources and Outcomes