


California's Rankings in the
29th Annual Highway Report
California’s highway system ranks 49th in the nation in overall cost-effectiveness and condition.
According to the Annual Highway Report by Reason Foundation, this is the same as last year’s ranking.
In safety and condition categories, California’s highways rank 47th in Rural Interstate Pavement Condition, 48th in Urban Interstate Pavement Condition, 39th in Rural Arterial Pavement Condition, 50th in Urban Arterial Pavement Condition, 25th in Structurally Deficient Bridges, 36th in Rural Fatality Rate, and 27th in Urban Fatality Rate. California ranks 46th out of the 50 states in traffic congestion, and its drivers spend about 49 hours a year stuck in traffic congestion.
In spending and cost-effectiveness, California ranks 41st in Capital and Bridge Disbursements, which are the costs of building new roads and bridges and widening existing ones. California ranks 44th in Maintenance Disbursements, such as the costs of repaving roads and filling in potholes. California’s Administrative Disbursements, including office spending that does not make its way to roads, rank 35th nationwide.
Compared to the previous report, the categories in which the state improved the most were Urban Fatality Rate (33rd to 27th) and Other Fatality Rate (45th to 39th). California worsened the most in Rural Fatality Rate (28th to 36th).
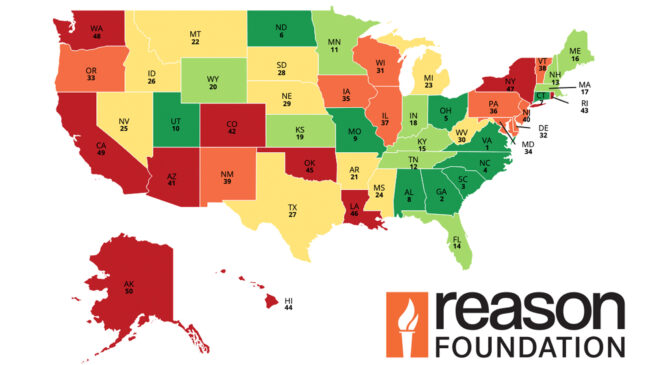
When compared to its neighboring states, California’s overall highway performance is worse than Nevada’s (25th), Idaho’s (26th), Oregon’s (33rd), Arizona’s (41st), and Washington’s (48th).
Comparing its overall performance to similarly populated states, California ranks worse than Florida (14th) and Texas (27th). “In terms of improving in the road condition and performance categories, California should focus on improving its Rural Interstate, Urban Interstate, and Urban Arterial Pavement Conditions, as well as reducing its traffic congestion,” said Baruch Feigenbaum, lead author of the 29th Annual Highway Report and senior managing director of transportation policy at Reason Foundation. “While the state performs relatively well in Structurally Deficient Bridges (25th) and Administrative Disbursements (35th), its consistently poor rankings in pavement condition and congestion remain areas of concern.”
Reason Foundation’s 29th Annual Highway Report evaluates the cost-effectiveness and performance of state-controlled highways across 13 categories, including pavement and bridge conditions, traffic fatalities, congestion, and spending. In the performance categories, a rank of 1 indicates the best outcome—for example, the lowest fatality rate or the best pavement quality—while a rank of 50 represents the worst outcomes. In the cost-effectiveness categories, a rank of 1 means the state spends the least, while a rank of 50 indicates the highest relative spending. The report’s data are primarily based on information each state submitted to the Federal Highway Administration for 2023, supplemented by deficient bridge data from Better Roads and Bridges and congestion data from INRIX. For full methodology and data sources, see the complete 29th Annual Highway Report.