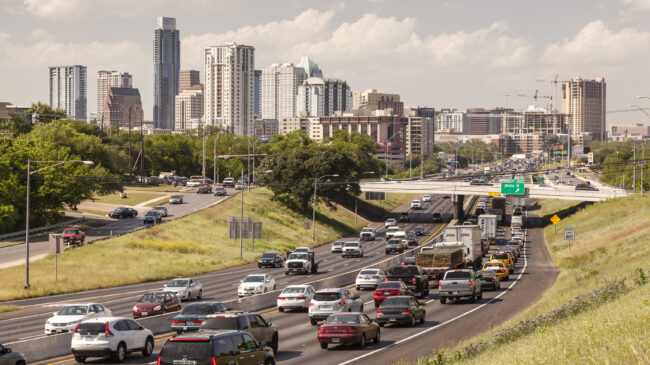

Criticisms of roadway travel are increasingly motivated by genuine concerns about emissions and infrastructure impacts as well as stakeholders’ desires to influence infrastructure spending. A recent Bloomberg CityLab article titled, The Unstoppable Appeal of Highway Expansion, is one example of smart growth groups using the induced demand argument as a rationale for not investing in roadway capacity, in this case, for Austin, Texas.
The induced demand argument, which says that widening roadways will lead to new and additional traffic, is not new nor without theoretical and empirical underpinnings. But the principle of induced demand is only relevant when used in the correct context and is misapplied when used as a one-size-fits-all justification for resisting roadway capacity expansion or is offered without an explanation of the effects. More importantly, both the theory and empirical foundations of induced demand need an update. Much of the data underlying prior publications on the topic are more than 20 years old and were conducted when travel behavior and trends were different.
A cynic would counter that this, “Don’t build it and they won’t come logic,” is a close relative to the, “We can’t build our way out of congestion logic,” and has as much merit as stopping school construction to solve classroom overcrowding. But induced demand is real even if it is often oversold. The concept has a long history and relies on the time-tested economic relationship between price and demand. Different definitions, metrics, time periods, and analysis methods result in a range of results.
There are five interpretations of what constitutes induced travel demand ranging from any demand beyond what existed prior to construction to new travel by pre-existing travelers. Some of these definitions are more valid than others.
The first interpretation of induced demand is that growth in demand is attributable to population, employment, or activity growth in the market area served by the facility. According to the U.S. Census Bureau, in July of 2020, the Austin urbanized area’s population was 2,295,303, a 3% increase from 2019, and the fastest growth among metros with at least 1 million residents. The Austin metro area has had a 34% population increase since 2010.
The October 2021 announcement of the relocation of the Tesla corporate headquarters to Austin, due partly to the pandemic and economic induced relocation trends, is the type of news that indicates growth is likely to remain robust. And this further growth will create a lot of new travel demand that is not induced by new pavement.
New transportation capacity can also have land-use impacts within a metropolitan area, as firms and residents seek to build near transportation capacity. Attracting development has often been a goal of transportation investments and is frequently cited as a benefit in economic impact evaluations of transportation investments. This new demand may not impact regionwide travel levels but may concentrate more activity in a given corridor.
The second interpretation of induced demand is associated with existing travel redistributing across the roadway network to shorten trips. Even before navigation apps started sending drivers through residential neighborhoods to avoid freeway traffic jams, drivers sought out alternative paths to severe traffic congestion. Traveling on freeways is considered preferable to traveling on surface streets as freeways are generally quicker, less circuitous, produce fewer greenhouse gasses than urban stop-and-go travel, and are safer. Fatality rates for urban freeways are typically only half as high as for urban arterials. Freeway travel also eliminates the risks of pedestrian and bicycle conflicts (in most states), a growing share of all fatalities. This change has no effect on total travel.
The third interpretation of induced demand is associated with existing travel changing their travel time to take advantage of additional capacity at the desired hour. This has no effect on total travel but enables individuals and commercial vehicle drivers to travel on their preferred route at a better time. A parent may get home in time to eat with the family, attend a sporting event, or proctor homework. A delivery vehicle may be able to deliver products more quickly. These benefits improve the quality of life for everybody.
The fourth interpretation of induced demand is associated with existing travel shifting from alternative modes due to new connections or capacity. The shift of travel from non-auto modes to automobiles is a part of the new traffic that has increased roadways volumes and contributed to induced demand. These mode shifts include carpooling to driving alone, transit to driving, or bicycling or walking to driving. The new capacity that reduces travel times makes driving more attractive. However, historical induced demand rates may not be accurate because there is less travel on non-auto modes to induce to roadways. Between 1980 and 2019, the percent of commuters carpooling decreased from 20% to 8.9%. In that same time span, transit use decreased from over 6% to 5% and walking declined from 5.6% to 2.6%. The transit commuting mode share was only 2% in Austin in 2019–not a lot of potential travel to be induced to use new road capacity.
Some planners see the lack of new road capacity as one way to shift solo commuters to other modes of travel. However, that is not a realistic proposition. For example, in Austin, a 3% sustained population growth would produce enough new commuters that, to keep roadway commute volumes constant, mass transit commuting use would need to increase 150% in a single year to absorb one year’s worth of new commuters and repeat that growth every year—a feat never accomplished in urban transit.
The fifth interpretation of induced demand is associated with new trips or trip length increases as trip distribution patterns change. Some consider this the true measure of induced demand as these are new trips by existing commuters. The lower time cost of travel associated with reduced congestion led commuters to travel more often and/or at greater distances. An individual may choose to travel farther to shop in a location that may have better choices or prices, be motivated to take a better job with a longer commute or make an additional trip that might have previously been deemed burdensome. These have historically been desirable outcomes of enhanced mobility created by new connections or new capacity. There may be economic and/or other benefits to this new travel.
However, given the changes in trip generation and trip length trends for personal travel, even if there is new capacity and new demand from existing users, it might not be due to new or widened highways. Travel demand changes over time.
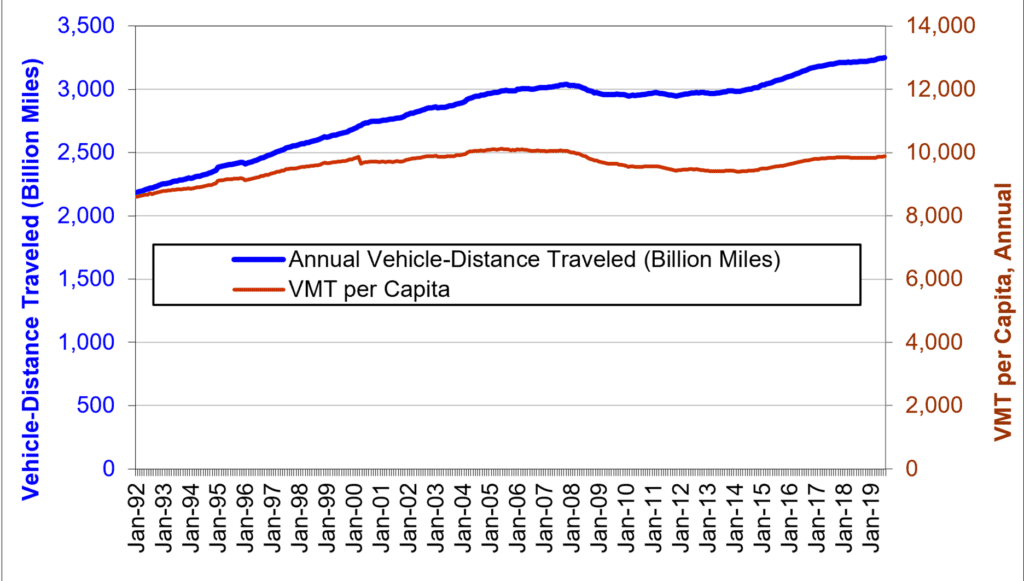
As shown in Figure 1, over the last 14 years vehicle miles of travel (VMT) per capita have moderated and not returned to the peak levels in the 2004-2007 period. Previously, VMT per capita had been growing despite a lack of new capacity. Between 1980 and 2015, the national lane miles of all roadways increased by about 11% and Interstate and freeway lane miles increased 39.6% while vehicle miles of travel (VMT) increased over 100%. At the national level, we have not tested the hypothesis that we cannot build our way out of congestion. Instead, demand has grown despite roadway capacity per capita shrinking. Arguably, demand is being induced despite a lack of new capacity.
The National Household Travel Survey data confirms the moderation in per capita demand. “The Case for Moderate Growth in Vehicle Miles of Travel: A Critical Juncture in U.S. Travel Behavior Trends,” notes that several trends that increased VMT have moderated or played themselves out. Suburbanization, declining household size, women joining the workforce, increased auto ownership, and diminished opportunities to shift from other modes are not as influential as they were 30 years ago in driving VMT growth. The travel patterns that drove historic levels of induced demand have changed.
Figure 1: Trends in Vehicle Miles of Travel and VMT per Person
The emerging opportunity to substitute telecommuting for travel is also likely to impact traffic inducement. Telecommuting and e-commerce are examples of people choosing to use communications in lieu of travel. The work-at-home share has grown from 2.3% in 1980 to 5.9% in 2019 and dramatically accelerated with the COVID-19 pandemic, resulting in expectations that post-COVID work-at-home shares will be over 10% and increase as the share of information jobs in the economy increases. E-commerce, distance-learning, online business transactions, and telemedicine are also likely to grow, moderating any increases in travel.
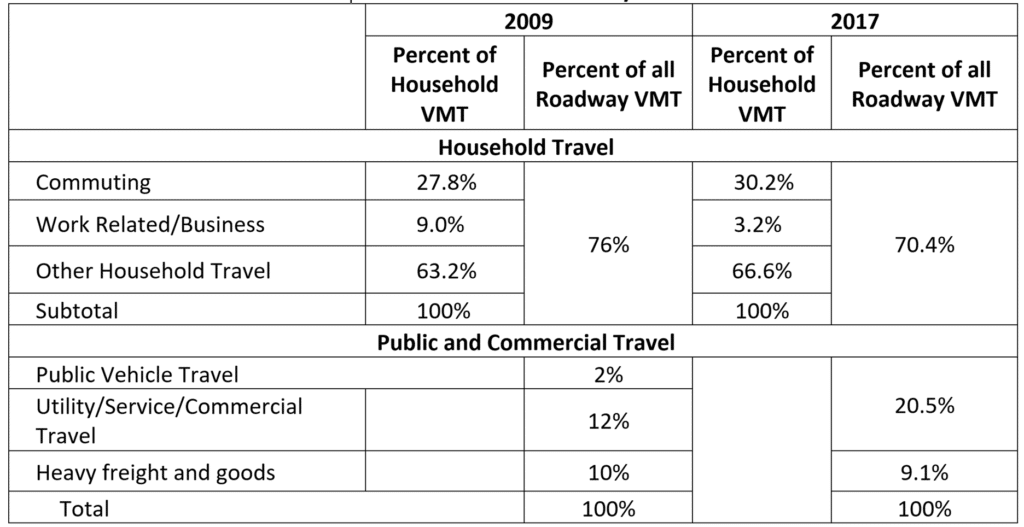
A growing share of roadway travel is not household-based person travel but commercial and service vehicle travel responding to business, government, and household needs. This includes police, fire, ambulance, mail, school buses, delivery vehicles, and the myriad of services we use—from lawn, insect, pool, and repair services and service visits such as home health care, realtors, and decorators.
Federal Highway Administration (FHWA) VMT and National Household Travel Survey (NHTS) data suggest that the share of commercial and service vehicles as well as heavy freight are 29.6% of all travel and growing (Table 1). There is no evidence that this demand is sensitive to roadway capacity and, importantly, this demand is not able to switch to alternative modes in the absence of new capacity.
Table 1: Sources of Roadway VMT
Travel cost/pricing, settlement patterns, population growth, and the deployment of automated vehicles are also likely to affect future travel demand. Sensitivity to the environmental impacts of travel is an increasingly important consideration in travel decisions and may offset the desire to take advantage of faster travel.
I have not studied the Austin Interstate project closely enough to determine if it is well justified or well-conceived, but I know that the need for roadway capacity goes well beyond any amount that might be “induced” and not building capacity will have significant consequences. A failure to add capacity is unlikely to steer meaningful shares of the demand to public transit absent a radical and impactful rebuilding of Austin and is more likely to induce businesses and residents to locate in other corridors or communities. Pre-COVID-19, Austin’s average bus occupancy was fewer than six passengers (motor bus and commuter bus passenger miles/vehicle revenue miles), which suggests that expanding bus services to attract travelers is both challenging and unlikely to offer a positive environmental benefit relative to auto travel.
It is transportation officials’ responsibility to vet and challenge proposed projects based on a full analysis of the impacts. Studying design options to improve transportation outcomes and reduce the effect on neighboring and broader communities is likewise a worthwhile endeavor. Impugning motives and misapplying or taking information out of context, however, is not helpful as decision-makers strive to make difficult and impactful decisions in an era of changing behaviors, technologies, and values. Finally, induced demand metrics need to be updated to reflect current travel behaviors and contexts.