
In this issue:
- Fresh thinking on urban transit
- Water resources bill a missed opportunity
- Resolving the commuting-time paradox
- Bicycle community’s quest for more
- Vehicle occupant detection breakthrough?
- Upcoming Conferences
- News Notes
- Quotable Quotes
Three Reports Offer Fresh Thinking on Urban Transit
During the last few weeks three refreshing perspectives on urban transit have crossed my screen, which I’m pleased to summarize and encourage you to read in full.
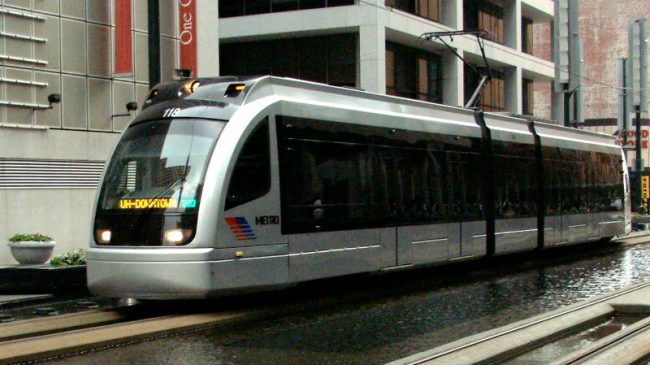
In the first piece, Henry Grabar recounts how transit consultant Jarrett Walker is helping Houston reconfigure its bus transit system, converting it into a “frequent network.” The idea is to refocus bus routes and frequencies toward corridors and areas with high potential ridership and away from places with low potential ridership. That sounds obvious, but politics in most metro areas stresses things like “geographic equity,” which generally spreads out bus service to large portions of the metro area where demand is low and costs are high. The aim of Walker’s redesign is to do just the opposite. Calculations predict that the revamped design will, with no increase in budget, increase bus ridership by 20%. The percentage of potential riders with access to frequent service will increase from 49% on weekdays (and just 25% on weekends) to 73% seven days a week, 15 hours a day. That is, of course, if politics does not veto the plan. The article has an over-hyped title of “Mass Transit Magic: How America’s Fourth-Largest City Can Abandon Its Addiction to Cars,” but is still very much worth reading (Salon, May 25th).
The second article takes a very different tack, “How Cars, Not Subways, Will Make Us Richer.” Written by Scott Beyer for the Daily Beast (June 4th), it begins with the 2011 study from Brookings finding that in America’s hundred largest metro areas, only 22% of low- and middle-skill jobs are accessible via transit in less than 90 minutes (which is more than three times the duration of the average auto commute, BTW). It then summarizes a report from the Urban Institute led by Rolf Pendall, which found that transit access has little effect on people’s economic success. By contrast, the study team found that low-income people with automobile access were twice as likely as transit users to find jobs and four times as likely to keep them. Beyer suggests that planners need to give greater attention to ways of increasing auto access for lower-income people who are not well-served by transit systems. The report is “Driving to Opportunity,” released by the Urban Institute in March 2014, written by a team of people from Urban Institute, the National Center for Smart Growth (at University of Maryland), and the Institute of Transportation Studies at UCLA.
Finally, the next day (June 5th) CityLab published a comprehensive piece by David Levinson of the University of Minnesota: “How to Make Mass Transit Financially Sustainable Once and for All.” To introduce the subject, he makes a good case that over the last 40 years or so, transit has been in a state of crisis that we have mostly refused to recognize. “Current strategies have not placed transit on a financially sustainable path,” he writes-and he’s correct. As a long-time transportation researcher, Levinson has thought a lot about this problem, concluding that “transit should be successful and cover its costs,” but to do that it needs to be reconceptualized as a kind of public utility. The rest of the piece sets forth and briefly explains seven key aspects of this model:
- Reduce costs by competitive tendering of bus service as done in London;
- Increase fares, so that the average farebox recovery eventually exceeds 100% of operating costs (with transit vouchers for the poor);
- Require the use of a smart card and encourage seasonal passes;
- Cancel money-losing routes unless someone is willing to subsidize them;
- Recover future capital costs via land value capture (see NCHRP synthesis 459, “Using the Economic Value Created by Transportation to Fund Transportation”);
- Raise capital in bond and equity markets, like other utilities do; and,
- Fund transit locally, since its benefits are local.
These are very provocative ideas, and I think they are worth serious consideration, as transit faces the likelihood of declining federal support and massive fleet replacement and infrastructure refurbishment costs in coming decades. And I find it encouraging that Levinson’s piece is part of the CityLab “Future of Transportation” series funded by the Rockefeller Foundation.
» return to top
The Water Resources Bill’s Missed Opportunity
America’s inland waterways are in sad shape, with aging locks and dams and chronic dredging problems. Unlike highways and railroads, the principal competitors of waterways for moving freight, waterways are largely funded out of federal general funds, with only a token user tax on fuel that covers just 8 to 10% of the capital and operating costs of the waterways system, according to U.S. DOT. Every so often Congress enacts a new Water Resources & Development Act that decides on harbor, waterways, and domestic water and wastewater projects overseen by the Army Corps of Engineers. As I write this, a new WRDA that passed with heavy bipartisan support has just received the President’s signature.
Although it contains a new federal loan program called WIFIA (inspired by the successful highways and transit TIFIA program) and a new Water Infrastructure PPP Program, those new efforts are seen as next-to-useless for waterways by the P3 community. To begin with, WIFIA does not even apply to waterways projects-only to the non-waterway programs authorized under WRDA. Also, it also prohibits the use of tax-exempt private activity bonds (PABs) on WIFIA-aided projects (which will make any such P3 projects a lot harder to finance compared with highway and transit projects that can use both PABs and TIFIA). The bill’s P3 provisions for waterways projects apply to new construction (design-build) projects only, and include no new dedicated revenue source (such as a toll to use a modern replacement lock). And each individual P3 project must be designated and approved by Congress.
A strikingly different approach has been proposed by an important waterways customer, the Soybean Export Council, in a new report released in December 2013 called “Proposed Public-Private Partnership Projects for U.S. Inland Waterways Infrastructure Financing, Operations, and Governance.” The report, done by the Horinko Group, shows both a solid understanding of what is wrong with the waterways status quo (governance and funding) and a real familiarity with what long-term P3s are, how they differ from the status quo, and what would be required to apply them to inland waterways projects.
First, the report questions-on sound economic grounds–the huge $62 billion Army Corps of Engineers backlog of “needs” to replace aging and obsolescent locks. It notes that barge traffic is in a long-term decline, despite its heavily subsidized, below-market prices to shippers. It strongly criticizes the Army Corps’ current policy of “fix-as-fail” (i.e., waiting till a lock fails before repairing it) as opposed to a more sensible asset-management policy of routine preventive maintenance. Second, it points out that for the average cost of one lock construction project ($377 million) the Corps could carry out nine major rehabilitation projects (average cost $41 million each). Based on these and other points, it recommends that a serious P3 program should focus on rehabilitation and long-term operations & maintenance, as being both more cost-effective than current policy and far more likely to be financeable (since many or perhaps most lock replacement projects could not pass a market test).
With some help from the soybean people, the report identifies two specific sets of locks (two on the Illinois River and three on the Upper Mississippi) as candidates for a pilot P3 program. It reviews several potential revenue streams (e.g, adding low-head hydro to the dams and selling the electricity) and finds them inadequate for debt service on the revenue bonds that would be needed to finance such projects. So it bites the bullet and concludes that “some type of user (lockage) fee, requiring congressional authorization, is needed.” And it cites examples such as the Panama Canal and several waterway P3 projects in Europe which are being financed based on such direct user fee revenue streams. An earlier (2012) report by the Soy Transportation Coalition noted that the Army Corps’ own Water Resources Institute has suggested lock tolls to finance P3 projects to improve individual waterways.
This report is the best thing I’ve read on fixing what’s wrong with America’s Inland Waterway system. It should provide guidance for a major restructuring (or at least a serious P3 pilot program) in the next WRDA bill.
» return to top
Resolving the Urban Travel Time Mystery
Much of today’s conventional wisdom about land-use and transportation maintains that “urban sprawl” is the reason for ever-longer commuting trips and much urban traffic congestion. This quote from the Sierra Club’s website is typical:
“Sprawl spreads development out over large amounts of land; puts long distances between homes, stores, and job centers; and makes people more and more dependent on driving in their daily lives . . . Sprawl lengthens trips and forces us to drive everywhere.”
Yet for three decades Peter Gordon and Harry Richardson have been using Census Bureau commuting statistics to show that average auto commute times have hardly increased at all, despite the ongoing trend of “sprawl” in all U.S. metro areas. In a 1996 paper, they used the example of metro Los Angeles to suggest that perhaps it is the development of polycentric urban areas, in which jobs follow residents to suburbs, that explains what they had called the commuting paradox.
But what had been surmised by observation has now been modeled using an economics-based model. In a March 2014 paper, “Why Are Urban Travel Times So Stable?” economist Alex Anas of SUNY Buffalo uses a computable general equilibrium model of the Chicago metro area to simulate the impact on travel time of the 24% population increase projected by the Chicago Metropolitan Agency for Planning (CMAP) between 2000 and 2030. The model includes changes in land prices over time that influence location decisions, which traditional transportation planning models ignore. The results are highly supportive of travel time stability.
In the paper Anas reviews several different runs of the model. The baseline version assumes that Chicago MSA highway capacity increases by 2030 to the extent assumed in CMAP’s long-range plan. This version shows urbanized land area increasing by 19%, but average commuting trip mileage getting shorter (per-capita work-trip VMT declines by 7.1%). Given the larger-than-average transit system in metro Chicago, transit trips increase by 55% between 2000 and 2030. Both average commute times and average overall trip times increase only modestly, however: automobile commute times by just under 3% (from 30 min. in 2000 to 31.7 in 2030); transit trip durations are nearly unchanged. In an alternate scenario in which no highway capacity is added, congestion is considerably greater than in the baseline, and VMT per person decreases by nearly 13.7%. In this version, car travel times increase over 30 years by only 4.5% for work trips and 6.25% for all trips. Transit use is slightly higher, increasing by 57% rather than the 55% increase in the baseline.
A significant factor in these changes is relocations of housing, services, and jobs to the suburbs and exurbs, even in the no-added-highway-capacity scenario. As Anas sums up:
“As congestion per mile increases with economic growth and slow expansion of road capacity, it is the switching to public transit, the reduction in lengths and numbers of non-work trips, and the relocation of jobs and population that keeps travel durations in check as businesses and consumers adjust to higher congestion. Cause and effect have been established, and there is indeed ‘no paradox’ as correctly conjectured by Gordon, Richardson, and Jun more than twenty years ago.”
Every transportation planner should read this challenging paper.
» return to top
The Bicycle Community’s Quest for More
There is a major push afoot to increase federal taxpayer support for bicycle commuting, with various advocacy groups trying various methods to get people to ignore the different roles of federal, state, and local governments. The idea seems to be that if something can be portrayed as “good,” federal taxpayers should be paying for it.
The first part of the campaign is to exaggerate the extent of bicycle commuting. The main source of detailed data is a May 2014 report from the Census Bureau, based on its American Community Survey data, called “Modes Less Traveled-Bicycling and Walking to Work in the United States: 2008-2012.” The headline figure used by cycling groups is that in large metro areas, bicycle commuting increased from 0.6% of all commuters in 2000 to 1.0% in the 2008-2012 period covered by ACS data. But as Figure 3 in “Modes Less Traveled” makes clear, between the 1980 census and 2010 (midpoint of the new ACS data), biking’s share of commuting nationwide increased from 0.5% to 0.6%. That led to a headline in Slate (May 8th) reading “Bicycle Commuting Rates Rocket from 0.5 Percent to 0.6 Percent in Only 32 Years.” Author Ben Mathis-Lilley-himself a cyclist– asked the question “Is it a nationally significant movement or the indulgence of a relatively negligible number of urban elites?”
A second part of the campaign is health benefits. To be sure, in general people who exercise are generally healthier than couch potatoes, but it’s far from clear that the handful of people who commute by bike would have any impact on comparative overall health statistics. Yet here is an April 17th headline from Streetsblog USA: “More Walking and Biking, Better Health: New Evidence from American Cities.” What follows this headline is Angie Schmidt’s brief article presenting three graphs comparing the incidence of diabetes, high blood pressure, and obesity not by city but by state, with scatter-plots of each state’s percent of bicycle/pedestrian commuting and its incidence of the health condition in question.
The correlations (R2) between bike/ped mode share and the medical condition range from a pathetic 0.4 for obesity to a still-dicey 0.52 for diabetes. There are likely dozens of variables far better correlated with the incidence of these conditions than biking or walking to work-and besides, as we all should know, correlation is not the same as causation.
A more serious concern is death and injury to pedestrians and cyclists due to interacting with automobiles on streets and highways. That is the focus of the latest edition of “Dangerous by Design,” also released in May by Smart Growth America and the National Complete Streets Coalition. Its methodology is to use data from the National Highway Traffic Safety Administration (NHTSA), aggregated for 360 U.S. metro areas to create for each a Pedestrian Danger Index (PDI). The PDI is the ratio of each metro area’s 2008-2012 average annual pedestrian fatality rate per capita and its percentage of commuters walking to work. The reported PDIs for large metro areas range from a high of 244 in Orlando to just 18.6 in Boston. Overall, there seems to be a direct relationship between the PDI and the extent of suburbanization, with the highest PDIs in the large low-density metro areas in states like Florida, Texas, Georgia, and Arizona and the lowest ones in denser metros like New York City, Pittsburgh, and Boston.
Needless to say, the news releases summarizing the study conveyed the “sprawl causes death” message, which was largely picked up on an array of news stories that I reviewed. But as I pointed out to a reporter who called me about the study, correlation does not equal causation. While the report asserts that suburbanized areas have higher pedestrian accidents and death rates because they are too auto-oriented, it provides no supporting data on the comparative amount of sidewalks, marked crosswalks, pedestrian walk lights, or anything of the kind. And although it presents national data that show different pedestrian fatality rates by age group and ethnic group, there is no attempt to see if those factors explain some of the variation among metro areas. So it’s not clear if the large differences in PDIs actually stem from too few sidewalks, fewer crosswalks, shorter walk lights, etc.–which is what the report asserts are needed.
So what do these groups want from Congress? The “Dangerous by Design” groups want to expand the budget for FHWA’s Transportation Alternatives program, which funds bike paths, sidewalks and the like, and was cut back in MAP-21. They also want a national “Complete Streets” policy, such that all roads and highways that get any federal money must have sidewalks, bike lanes, etc. The bike/ped community is also promoting a proposed New Opportunities for Bicycle and Pedestrian Infrastructure Financing Act (NOBPIFA) that would dedicate 1% of TIFIA’s $1 billion authorization to loans for bike and pedestrian projects. NOBPIFA has been introduced by Rep. Albio Sires (D, NJ) and has several co-sponsors. A bill to require “complete streets” principles in all federal-aid road projects, the Safe Streets Act, introduced by Sens. Brian Schatz (D, HI) and Mark Begich (D, AK) would require all states and Metropolitan Planning Organizations to adopt complete streets policies within two years.
On a more positive note, I was interested to see, late last year, that the idea of bicyclists actually paying something for the facilities they demand is cropping up here and there. In December a Chicago City Council member proposed a $25 annual cycling tax. The outrage from Chicago cyclists was predictably intense. An AP report on this contretemps noted that “Two or three states consider legislation each year for some type of cycling registration and tax-complete with decals or mini-license plates, National Conference of State Legislatures policy specialist Douglas Shinkle said. This year [2013] it was Georgia, Oregon, Washington, and Vermont. The Oregon legislation, which failed, would even have applied to children.” I actually remember getting a small bicycle license plate when I was a kid, presumably paid for by my parents. The tighter state transportation budgets become, the more likely it is that bicyclists will be asked to pay at least something for the infrastructure they are increasingly demanding.
» return to top
Vehicle Occupancy Detection-a Breakthrough?
The quest for an accurate, reliable way to verify how many people are in a vehicle using an HOV or HOT lane has been long and difficult. A number of different methods have been proposed, ranging from in-vehicle sensors to various roadside detection devices, generally involving cameras using various parts of the spectrum. The in-vehicle approach is a non-starter, since it would require outfitting all new vehicles with a technology that only a handful of buyers would ever have a use for-and which would take about 20 years for new vehicles to replace old ones so that nearly the entire fleet would be equipped. And with the growing trend toward HOV-3 requirements in HOV and HOT lanes, detecting back-seat passengers is increasingly a system requirement.
The pioneering company in roadside occupancy detection is UK-based Vehicle Occupancy Detection Corporation (VODC), whose device called Dtect has gone through about a decade’s worth of technology evolution and on-road trials. But in April this year Xerox announced its own system, “using patented video analytics and geometric algorithms” for occupancy detection. Do either of these systems actually deliver?
Tollroadsnews.com carried an interview with VODC’s CEO Kenneth Brown on Jan. 29, 2014. In it, Brown disclosed that the latest version of Dtect uses two different shortwave frequencies which he says are reflected back from human bodies at different rates, thereby distinguishing humans from animals, dummies, etc. He said this new version was now being used in a Caltrans testing program being audited by Prof. Art MacCarley of California Polytechnic State University. As the time of the interview, the tests were being done at 10-15 mph as vehicles were exiting the freeway, but Brown told the interviewer that their newest (and far more expensive) model, P-90, can read accurately at up to 90 mph. The test set-up imaged occupants from overhead, through the windshield. But Brown said they plan to test cameras mounted at the side of a lane looking into the car horizontally to detect back-seat occupants. I have not seen any subsequent reports on tests at higher speeds or on back-seat detection.
I learned of the new Xerox Vehicle Passenger Detection System from their April news release. A five-minute audio blog on Xerox.com has the company’s Mark Castelli giving an overview. He says the system resulted from matching the tolling-services experience of Xerox-acquired ACS with camera, illumination, and algorithm capabilities at Xerox to develop a system that can distinguish the unique shapes of humans in vehicles, at speeds up to 100 mph and in both front and rear seats. Castelli also refers to pilot testing at two agencies: Minnesota DOT and the Bay Area Toll Authority, operator of all but one of the toll bridges in the San Francisco Bay Area. I contacted both agencies for details, and MinnDOT told me that although Xerox had submitted a proposal in response to an RFP for innovative ITS concepts, it had not been accepted. At press time I had not heard back from BATA. If-and I emphasize if-real-world tests show that the Xerox system can do what Castelli claims, and if its cost is reasonable, this would likely be the first truly workable system for automated vehicle occupancy detection.
My guess is that the cost of any such system is likely to be too high for HOV lane enforcement, where the stakes in terms of dollars are not that great. But where toll revenue is at stake, as in HOT lane systems, the cost of the occupancy detection system would have to be weighed against the savings from toll-revenue losses prevented. Those calculations will depend on how well an occupancy detection system works as well as how much it costs. For now, the jury is still out.
» return to top
Note: I don’t have space to list all transportation conferences that might be of interest. Below are those that I or a Reason Foundation colleague are taking part in.
TRB Fifth International Finance Conference, July 9-11, Beckman Conference Center, Irvine, CA (Adrian Moore and Robert Poole speaking). Details at www.trb.org/conferences/finance2014.aspx.
26th Annual Public Private Partnerships in Transportation Conference, July 16-18, Washington Court Hotel, Washington, DC (Robert Poole speaking). Details at www.ARTBAP3.org
P3 Connect 2014, July 28-30, Sheraton Denver Downtown, Denver, CO (Leonard Gilroy speaking). Details at www.ncppp.org/p3connect
» return to top
News Notes
World’s First Express Toll Lanes on a Toll Road. Although Florida’s Turnpike Enterprise late in 2012 announced plans to add variably priced express toll lanes (ETLs) to two of its toll roads, the first such ETLs have actually been in operation for the last nine months in Puerto Rico, reports Public Works Financing. The ETLs were added to the PR-22/PR-5 toll roads as part of the 40-year concession won in 2011 by Abertis USA. The two reversible ETLs opened in August 2013. Buses use the lanes at no charge but all other vehicles pay variable toll rates.
Lack of Tolling Kills Kentucky P3 Bill. Kentucky Gov. Steve Beshear vetoed public-private partnership legislation aimed at providing a way to finance and build the long-planned Brent Spence Bridge replacement. The original bill had included tolls as the principal revenue source, but it was amended to remove tolling. Without a funding source for the $2.5 billion project, the governor killed the bill as meaningless.
California Considers Mileage Based User Fee Test. Legislation pending in the California Senate would authorize Caltrans and the Department of Motor Vehicles to develop and implement a pilot project in one jurisdiction under which state per-gallon fuel taxes would be replaced by a per-mile charge or tax. The bill has the support of Caltrans. If the bill is enacted, California would join Oregon and Washington in testing mileage-based user fees as a fuel-tax replacement.
Two New Managed Lanes Concessions Awarded. Florida DOT and North Carolina DOT have each awarded new concessions for projects to add express toll lanes to congested expressways. Florida’s $2.3 billion project will add four ETLs to 21 miles of I-4 in Orlando, in addition to reconstructing that entire stretch of I-4. Since toll revenue on the four ETLs cannot cover the entire cost, the winning team headed by Skanska/Laing will be compensated by availability payments, with FDOT keeping all the toll revenues during the 40-year concession. North Carolina’s $655 million project will add ETLs to a stretch of I-77 in Charlotte, under a 50-year toll concession being negotiated with winning bidder Cintra.
Transparency Reforms for P3 Concessions in Colorado and Virginia. Colorado Gov. John Hickenlooper vetoed a bill that would have imposed onerous conditions on public-private partnership concessions, after 50 infrastructure companies and organizations pointed out its negative effects. But since part of the bill would have increased transparency in such deals, he issued an executive order adding additional transparency requirements in P3 procurements. New Gov. Terry McAuliffe in Virginia led the Commonwealth Transportation Board to adopt a resolution increasing transparency requirements for P3 procurements in that state, which has been a national leader in using concessions for large-scale projects.
Port of Miami Tunnel Opening Ceremonies. The $914 million Port of Miami Tunnel was dedicated on May 19th, though its official opening was delayed several weeks for additional testing of all systems. The project was developed under a 35-year availability-payment concession agreement with the team led by Bouygues and Meridiam and was completed on time and on budget. Once open to traffic, it will route cargo port and cruise ship traffic away from downtown Miami streets and directly into the expressway system.
Assessing Tea-Party and Property-Rights Efforts vs. Regional Planning. A fascinating political science assessment of grass-roots opposition to comprehensive regional planning efforts appears in the Journal of the American Planning Association. “The Actions of Discontent: Tea Party and Property Rights Activists Pushing Back Against Regional Planning” was researched and written by Karen Trapenberg Frick of the Dept. of City & Regional Planning at UC Berkeley. It’s the first academic study I’ve seen that makes a serious effort to understand the concerns of these groups, as illustrated by case studies of such activism in metro Atlanta and the San Francisco Bay Area.
Southeastern Tolling Interoperability by End of 2014. Georgia’s State Road & Tollway Authority announced last month that by year-end its Peach Pass electronic tolling system will be interoperable with both Florida’s SunPass and North Carolina’s QuickPass. In turn, those systems are moving toward interoperability with the 15-state E-ZPass system in the Northeast and Midwest.
Eurotunnel Moving Toward Profitability After 20 Years. The landmark Channel Tunnel between France and the U.K. was completed late and at twice the projected cost. And even now, 20 years later, its traffic is only half of what was originally projected. Yet according to The Economist (May 10th), its prospects are looking up. Both passenger and freight traffic are increasing, with revenues up 12% in 2013. And long-awaited railroad deregulation in the European Union means that Germany’s Deutsche Bahn passenger trains will soon be joining those of the U.K. and France, adding many additional trips and more revenue for Eurotunnel. It’s a good thing Eurotunnel has a 99-year concession: some infrastructure investments are truly long-term.
Classics of Megaproject Planning and Management. Oxford University infrastructure expert Bent Flyvbjerg has announced a new book which he has edited, including many classic articles and papers on the planning and management of megaprojects. The 70 contributions include pieces by Alan Altshuler, Peter Hall, Albert O. Hirschman, and many others. Megaproject Planning and Management: Essential Readings has just been published in hardback by Edward Elgar. A description and table of contents is online at: http://bit.ly/1mxH9qa.
Feedback on Colorado US 36 Project. Will Toor of the Southwest Energy Efficiency Project emailed in response to last issue’s article about the toll concession legislation that was subsequently vetoed by Colorado’s governor. As an advocate of increasing the number of alternative fuel vehicles allowed to use HOV and express toll lanes (at no charge) from the current 2,000 to 6,000, he noted that recent data on the use by such vehicles of the I-25 HOT lanes and E-470 is about 185 per day, with about 25 of those in the peak direction, peak hour. Tripling this would mean only 75 potentially in the US 36 ETLs during peaks, a small fraction of its capacity. That sounds innocuous for today, but this is a 50-year concession, and over that time period the use of such vehicles could increase dramatically, especially if groups like his continue to be effective lobbyists.
Feedback on Tappan Zee Bridge. Engineer Raymond Tillman took issue with my writing, last issue, that the Tappan Zee Bridge needed replacing due to its age. He attributes its deteriorated condition to extensive deferred maintenance, due to governors of both parties refusing to allow toll rate increases for 17 years, during which operations and maintenance costs were going up at 5-8% per year. Well-maintained bridges can last 100 years or more, so I think Tillman is on target here, given that the bridge opened in 1955, making it just 59 years old.
» return to top
“The real crisis is that we are fixing [infrastructure] problems the wrong way. People believe the federal government will come to the rescue through a National Infrastructure Bank, or boost spending through an increase in the gas tax. But the federal government essentially can’t and won’t fix our national infrastructure. . . . This has significant implications for how America designs, finances, and delivers its infrastructure. In the future, true partnerships of government entities, private firms, financiers, and philanthropies outside of Washington will need to do the hard work to get stuff done.”
-Robert Puentes and Bruce Katz, “To Fix America’s Infrastructure, Washington Needs to Get Out of the Way,” Brookings Institution, May 12, 2014
“Over the years we have shackled ourselves with successive layers of policies and procedures that are not legal requirements and often don’t result in better projects. Then we wait for one reviewer to comment before moving sequentially to the next one. And that review may well trigger a re-review of previous approvals. The result: uncertain outcomes, coupled to an excruciatingly long timeframe. Federal agencies have the legal authority today to concurrently review major projects, with comments posted online and collaborative decision-making occurring in real time. Unfortunately, it is still the rare projects . . . that get to take advantage of this kind of real collaboration. Front-loading the approval process with greater community and agency collaboration helps to build a consensus on outcomes and avoid nasty surprises at the end of the process. For elected officials, a front-loaded process is also an important risk-reduction phase.”
-John D. Porcari, former U.S. Deputy Secretary of Transportation, “Moving Transportation Projects into the Fast Lane,” Governing, May 12, 2014
“The Obama Administration’s reauthorization proposal to give states the right to choose to add tolls to existing free Interstate routes is a big step in the right direction. The Interstate system was conceived and largely financed by the federal government, but they own virtually none of it. The entire 47,000 mile system is owned by the states, and they have ultimate responsibility for maintenance, expansion, and reconstruction. As much of the system is now more than 50 years old, states are left ‘holding the bag’ for rebuilding the system.”
-Ed Regan, CDM Smith, “Interstate Tolling Poses New Challenges,” Public Works Financing, May 2014
“There were always at least two problems with the ‘return to the city’ thesis. First of all, most people who live in the suburbs came from areas outside metropolitan areas, and they couldn’t return to where they had never lived. More importantly, in every year for which there is data, net inward migration to suburbs has been far greater than to the core counties, which have nearly always had a net outward migration. Under these conditions, there could not have been net migration from the suburbs to the core municipalities.”
-Wendell Cox, “From Anecdotes to Data: Core and Suburban Growth Trends, 2010-2013, New Geography.com, May 23, 2014