

Every state pension plan gets to decide what kind of accounting practices it wants to follow when reporting the value of its assets and size of its unfunded liability. As a result, states have adopted a range of different approaches, leading to inconsistencies in the reported amount of pension debt compared to more accurate methods of measuring the promises made to teachers, police officers, firefighters, and other public-sector workers. And it should not be a surprise that some states are using practices that significantly understate the amount of their promised pensions.
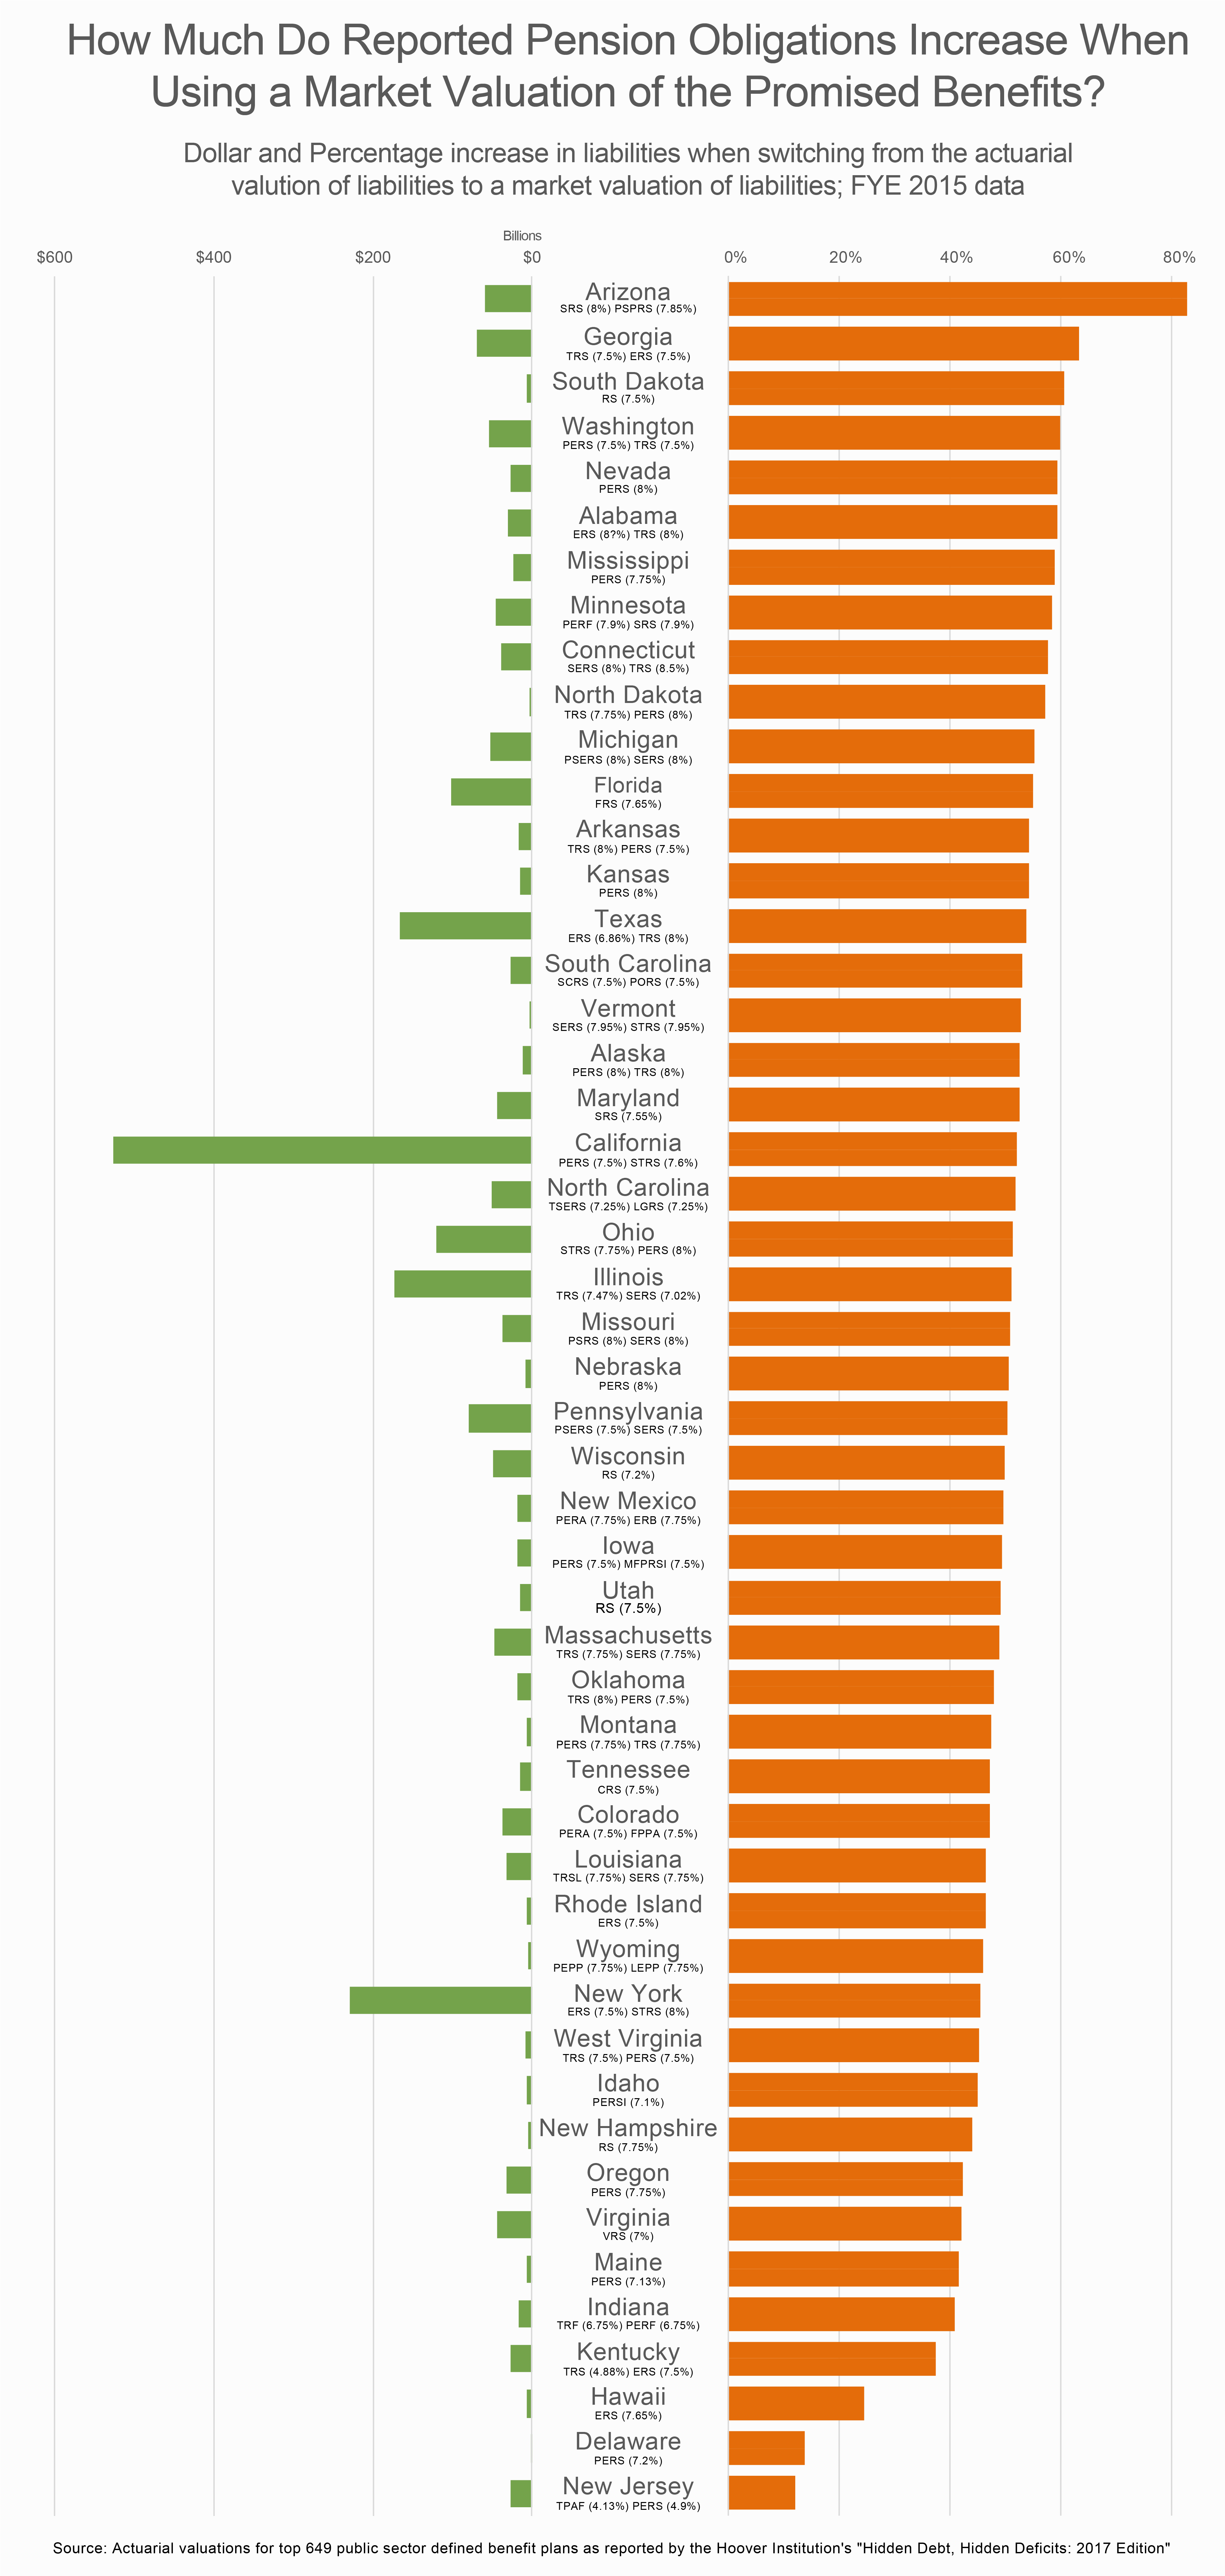
Who are the worst offenders and how badly understated are pension unfunded liabilities? We have analyzed the actuarial valuations of the top 649 pension plans in the country to compare their reported value of unfunded liabilities versus the value of this pension debt using a “market value of liabilities.” The nearby infographic ranks the states by the percentage increase in pension debt that is revealed when using a market valuation of liabilities. It also displays the dollar increase in liabilities when recalculated with a market valuation as well as the discount rates used by major state pensions. Below the infographic is a discussion of what drives the data.[1]
What are Market Valued Liabilities?
When actuaries set out to determine the present value of future promised pension benefits, they use an interest rate to discount pension liabilities. The standard practice for public sector defined benefit plans is to use the expected rate of return on investments as the discount rate when valuing such public pension obligations. However, the expected rate of return on assets is based on the particular asset allocation for a pension plan’s portfolio and how risky the investments are distributed. Which means that pension plans are measuring the value of their pension promises (“liabilities”) based on the risk in the pension investments (“assets”). And this flies in the face of basic financial economics.
It is more appropriate to discount pension obligations the way any other kind of debt would be measured, by using a risk-free rate of return plus some risk premium that is based on the actual risk of a state not fulfilling its promises. Such an approach means using a market valuation of liabilities (MVL).
The difference between using an MVL to discount pension obligations and the actuarial valuation of liabilities (AVL) can be stark. Most public plans have expanded the risk in their portfolios over the past few decades and have expected returns of 7% to 7.5%. However, risk-free rates of return that are based on, say, Treasury yields have typically been between 2% and 4% over the past decade. All else equal, the lower the discount rate, the higher the reported value of pension obligations. And vice versa. Thus, the lower the discount rate the higher the reported value of unfunded liabilities.[2]
How To Use Market Valued Liabilities
At a glance, some state funded ratios look great. For example, South Dakota has the highest reported funded ratio in the nation, coming in at 102.97%, as of the end of 2015. However, when we re-discounted their liabilities by using a 3% discount rate (MVL) instead of their 7.5% discount rate (AVL), the size of the state’s unfunded liability jumped more than 60%.
Arizona’s percentage change in liability grew the most from the stated figure to the rediscounted MVL number. The largest plan in the state — the Arizona State Retirement System — still uses an 8% assumed rate of return and discount rate, meaning there is a major correction when adopting a more accurate discounting method. The reported value of ASRS unfunded liabilities at the end of 2015 was $15.6 billion, but using an MVL the size of the unfunded liability is closer to $62.3 billion.[3]
By contrast, the bottom of our list features states that are very poorly funded, but have more accurately reported this fact in their valuations. For example, Jersey boasts the lowest funding ratio in the nation (37.5% as of FYE 2015). But the funded ratio recalculated according to MVL is not that different (33.5%). The reason is that New Jersey is already using a low discount rate when reporting the value of its unfunded liabilities by adhering to new GASB accounting rules. Several New Jersey pension funds are projected to reach exhaustion at a future date, at which point GASB requires using a high-quality municipal bond rate as the discount rate. The “blended” result is that New Jersey discounted all of their liabilities at a weighted 4.77% — much lower than the expected returns on the state’s pension investments that settle at 7.9%.
Kentucky appears on the lower part of the ranking for similar reasons. With a stated funded ratio of just 42.12%, the Commonwealth of Kentucky is facing future difficulties in being able to live up to its promises to retirees. Similar to New Jersey, Kentucky’s Teachers’ Retirement System (TRS) is projected to become insolvent in 2022, and therefore uses a municipal bond rate for discounting under GASB rules (which are voluntary for every state). The TRS liability is discounted at 4.88%, while the rest of Kentucky’s funds were discounted at the usual 7.5% in 2015. (It should be noted that the Commonwealth has already lowered the discount rate for two major plans within the Kentucky Retirement Systems (KRS) to 5.25% in 2017.)
As the results of our analysis demonstrate, lower starting discount rates lead to lower percentage change. For those states that have moved to discount at lower rates, their stated liabilities are less susceptible to possibly inflated discount rates.
States that saw a large percentage change in liabilities when we re-discounted their liabilities using an MVL ought to consider adopting more conservative discounting methods, as they are the most at risk of understating their liability. Stated unfunded liabilities and funding ratios are often masking a debt level that is actually much higher, even in states that appear to be in comparatively good standing with pension funding.
Notes and Methodology
[1] Using the chart above, we are able to see which states see the most change after going through the rediscounting process. These results help us to understand the level to which each state benefits from ambitious discount rates. Due to varying convexities, some states saw a greater change in calculated liabilities than others.
[2] In a recent study, Stanford professor Joshua Rauh rediscounted the liabilities of 649 pension systems according to market valued discount rates. The results provide an interesting look into the value of promised pension obligations for state governments. When using the market valued discount method, liabilities are much higher for nearly all pension systems. Most notable, however, is the fact that rediscounting in this way affects some states more than others. Since each pension system uses its own calculations to estimate several factors (such as separation rates and payroll growth), each pension reacts differently when rediscounting to a lower rate. One system’s liability may move a great deal more than another’s when the discount rate is altered. This characteristic is referred to as convexity.
[3] The state has recently undergone major reforms in their Public Safety Personnel Retirement System (PSPRS) and Corrections Officer Retirement Plan (CORP), which create incentives for the newly restructured PSPRS pension board (which administers both plans) to evaluate the previously used actuarial assumptions. Since the FYE 2015 data was reported the PSPRS discount rate has fallen from 7.85% to 7.4%, which is the right direction for having more accurate unfunded liability figures.