

A recent study by Joe Nation at the Stanford Institute for Economic Policy Research shows how rising pension costs in California have crowded out government services.
The study looks at a sample of 14 California jurisdictions, including the state of California, three counties, six cities, three school districts, and a special district. The author examines both historical and projected trends in employer contributions and funding levels, covering a period from fiscal years 2002-03 to 2029-30. For projected trends, two scenarios are provided: a baseline scenario where the investment return assumption and other actuarial assumptions are met, and an alternative scenario where the return falls short by 2%. For funding levels, two measures are given: the actuarial measure provided by the pension systems and the market measure, which uses the market value of assets and discounts the pension liability with a 20-year US Treasury bond yield (which is about 2.6%).
Before getting to the results, it’s worth emphasizing again here that California public pension plans (and U.S. public plans in general) follow much more lenient funding rules than their private counterparts. And this is not only about the much-discussed discount rate. As shown in Table 1 below (taken from the study) compared to private plans California’s public plans use markedly higher discount rates and adopt amortization and valuation techniques that significantly delay the payments for unfunded liability. These differences are a major factor explaining, also as depicted below, how public pension costs have increased so much in the past—and are expected to rise further in the future—since artificially suppressed contributions must eventually catch up with reality.
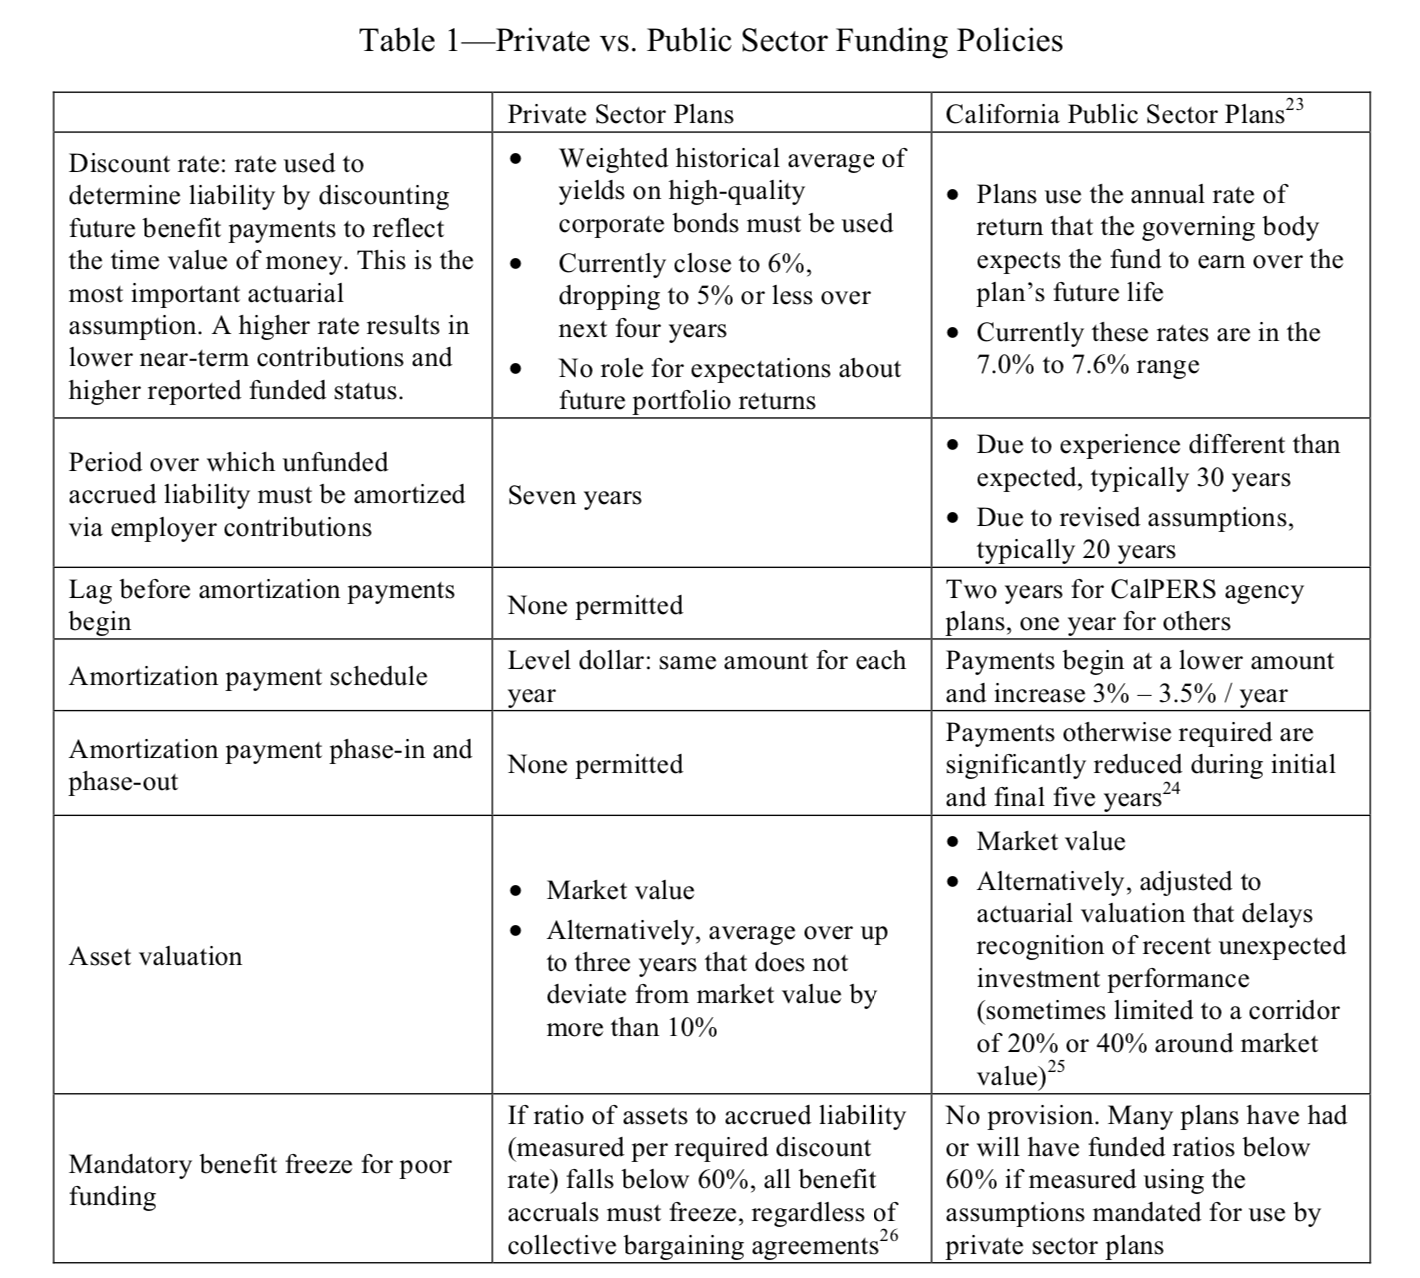
Source: “Pension Math: Public Pension Spending and Service Crowd Out in California, 2003-2030”, Joe Nation – pg. 7
The study finds that among the 14 case studies, employer pension contributions grew by 400% in nominal dollars during the FY 2003-2018 period, compared with the 46% growth rate in general fund operating expenditures. Figure 41 from the study shows this striking mismatch across the jurisdictions. As a share of operating expenditures, the employer contributions have tripled from 3.9% to 11.45% since 2002-03.
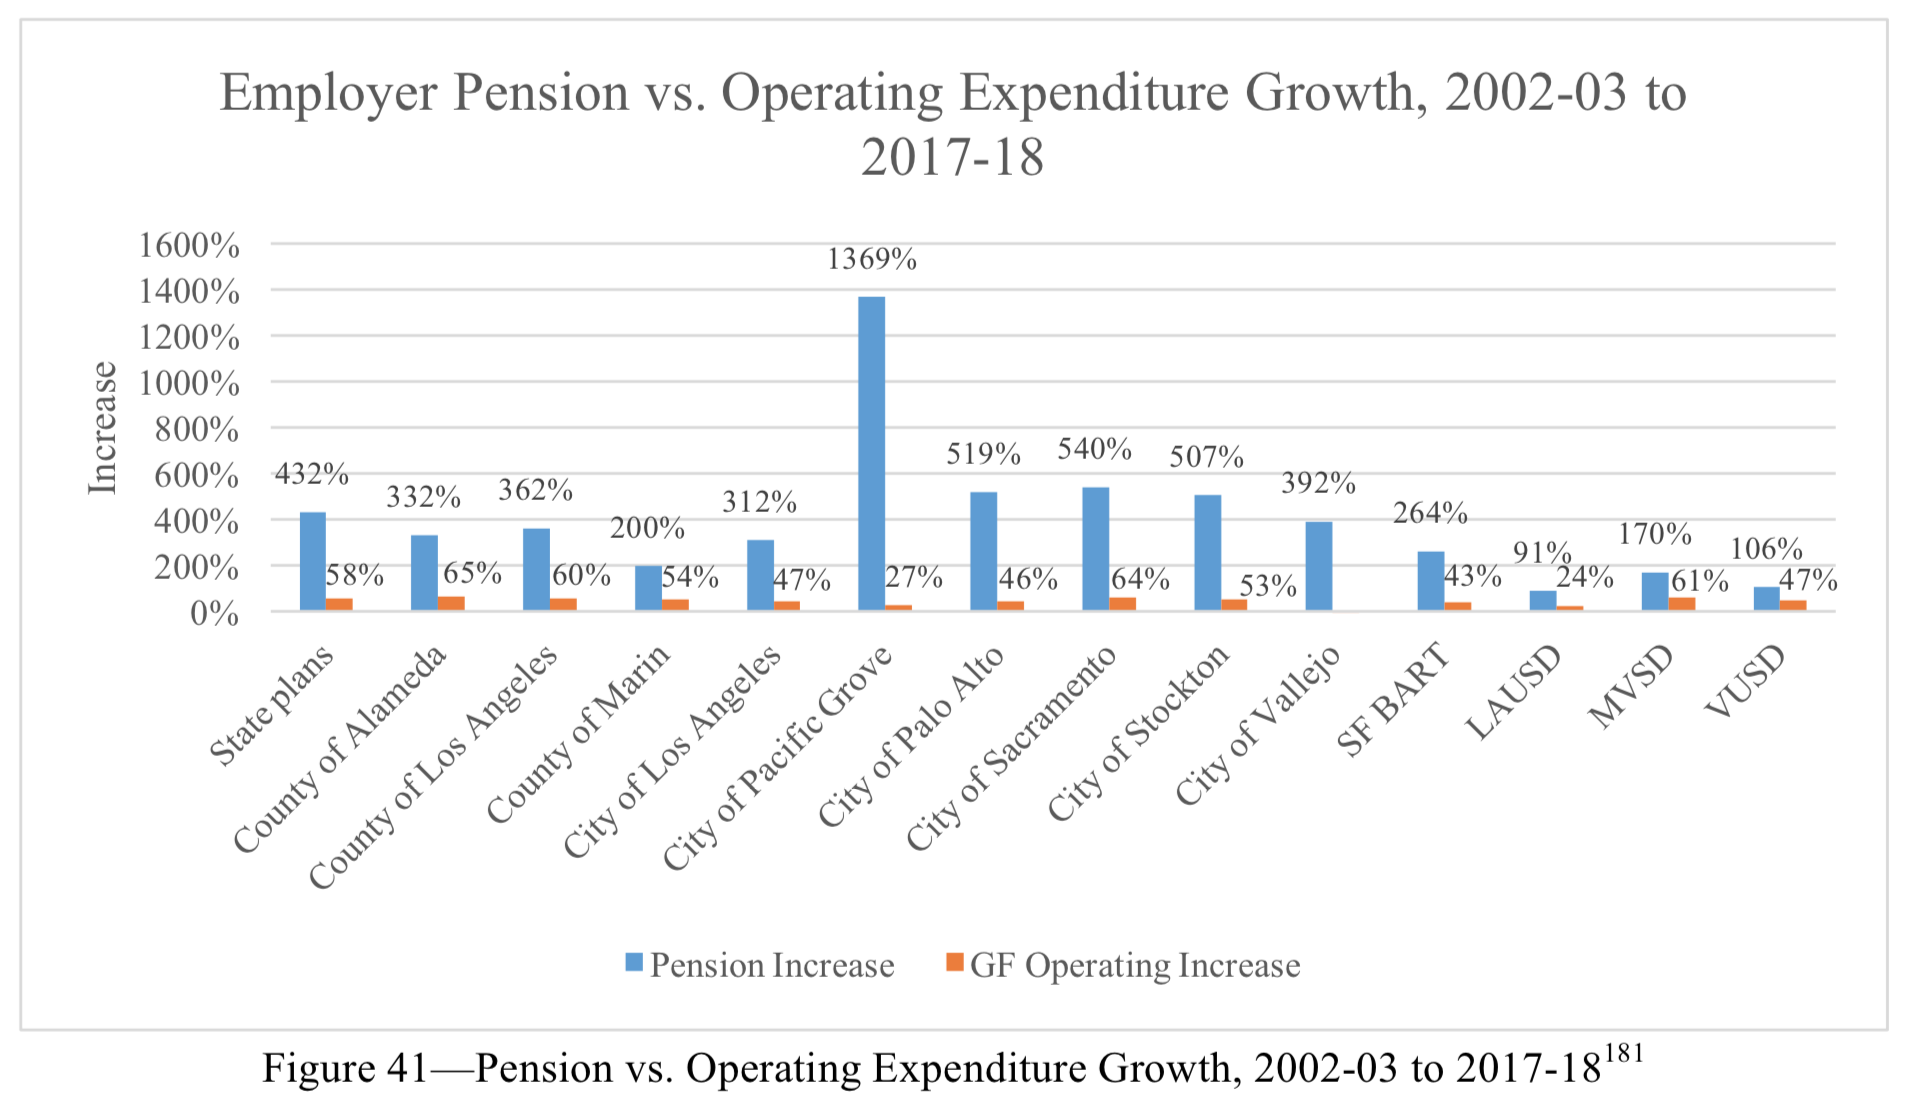
Source: “Pension Math: Public Pension Spending and Service Crowd Out in California, 2003-2030”, Joe Nation – pg. 77
As pension contributions rose much faster than operating expenses, something must give. The study looks into each case study and finds that the rising pension costs have been offset by reductions in other public areas, including social services, higher education, healthcare, public works, public safety, recreation, and salaries of the very employees that earn the pension benefits.
Now, some small-government advocates may opine that this is probably a good thing, since government shouldn’t be involved that much in these areas in the first place. But that would miss the point. Even if you’re a libertarian who believes most government services are illegitimate, you should still care about the efficiency in providing these services, given that these services exist and taxpayers are currently required to pay for them. The crowding out of public services due to increasingly expensive pension costs certainly does not indicate efficiency.
And there is more to come. The pension share of operating expenditures is projected by the study to increase further from the current 11.45% to 14% by 2029-30 under the baseline scenario and to 17.5% under the alternative scenario. Figure 43 from the study shows the projected pension shares of operating expenses across the sampled jurisdictions over the next twelve years under both scenarios. The chart indicates that even if future investment performance matches the assumed returns, the pension cost burden will still get bigger for most of the jurisdictions. And given the low expectations of long-term investment returns, the service crowd-out will likely go further downhill for all of them in the next decade.
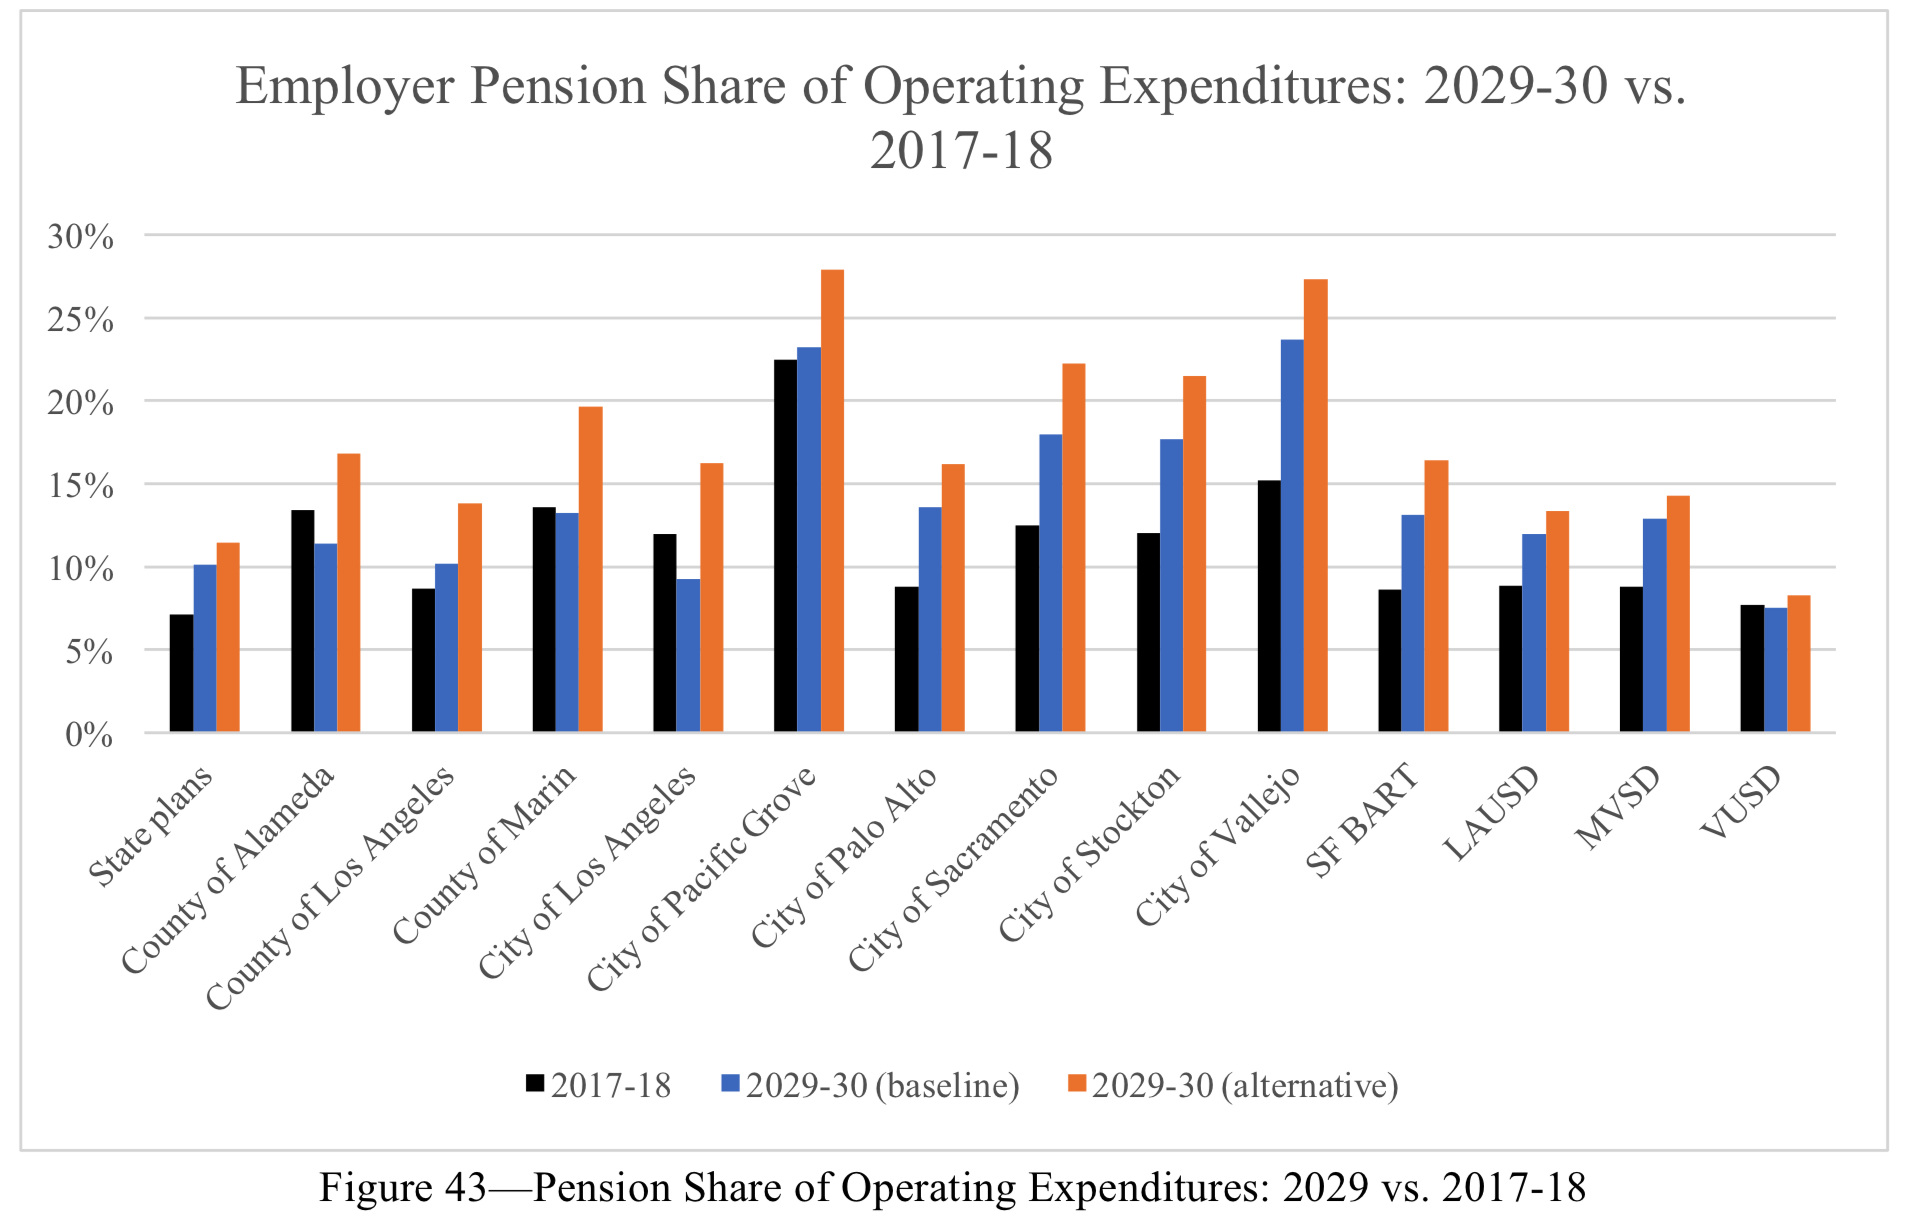
Source: “Pension Math: Public Pension Spending and Service Crowd Out in California, 2003-2030”, Joe Nation – pg. 79
Though the projected increases in pension contributions seem significant, they are still not enough to produce a healthy funding level. The study finds that on an actuarial basis, the average funded ratio is projected to reach 69.7% under the alternative scenario and 84.8% under the baseline scenario by 2029, which is still well below full funding. On a market basis, these numbers are considerably lower at 39% and 48.2%, respectively.
The numbers illustrate both how flawed the valuation approach commonly employed by public plans is and how far their current funding policies are lagging behind the full funding target. This is directly related to Table 1 previously shown, and it implies that the current and projected crowding out of government services over the next decade is just the tip of the iceberg.
The first step of solving a problem is recognizing that there is one. Unless governments in California (and state and local governments in general) acknowledge the need to reform valuation and funding policies for their pension plans, the true pension costs will continue being hidden and the crowding out effect won’t be fundamentally addressed.